Fig. 6
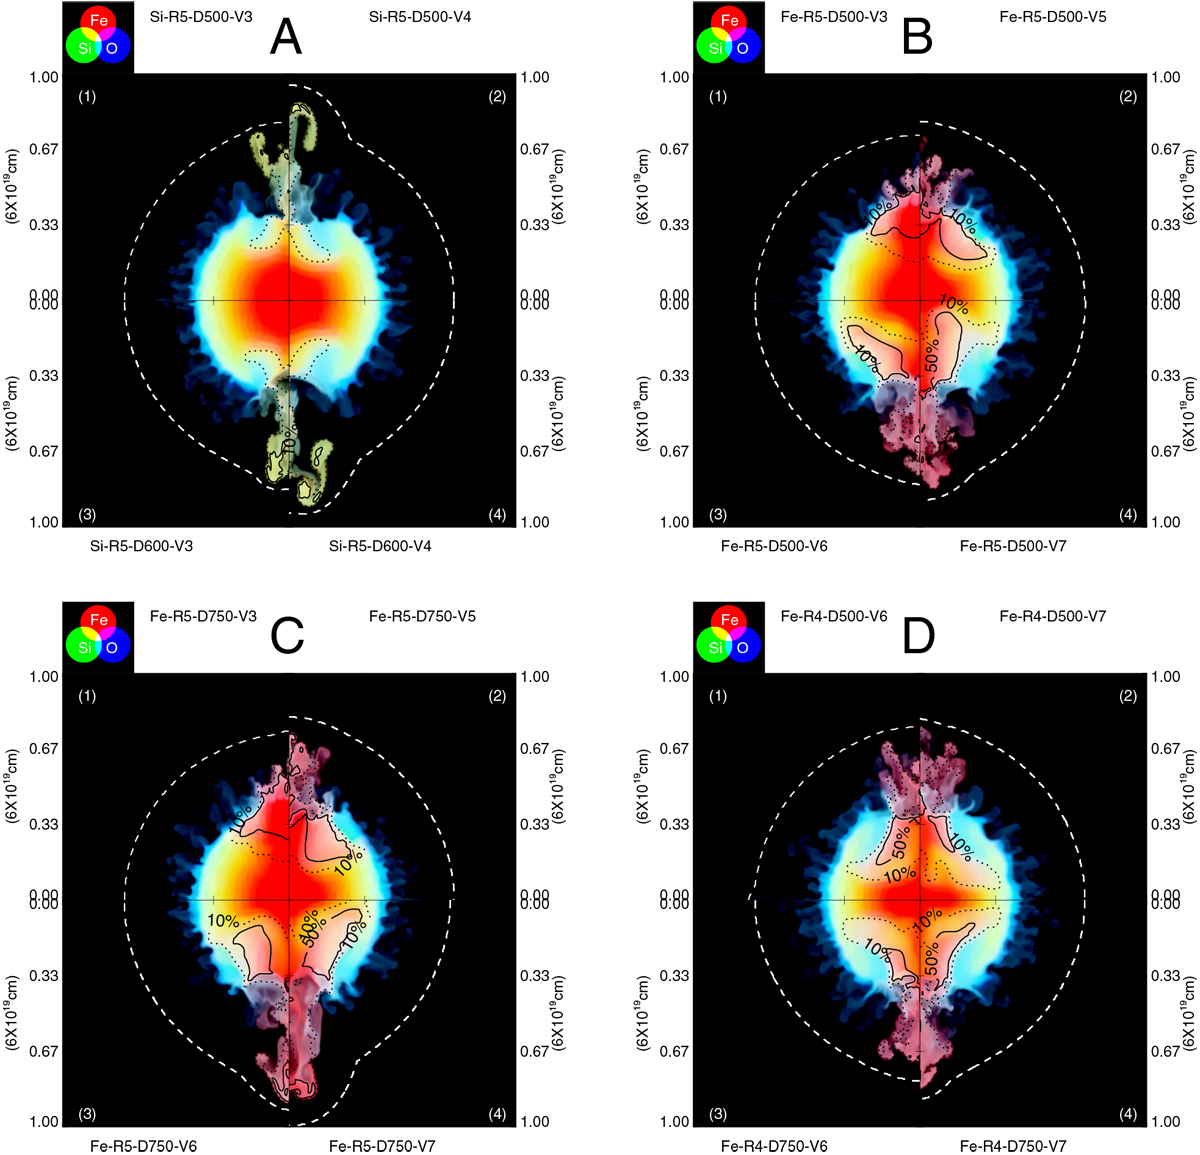
Color-coded images of the logarithm of the ejecta mass fraction (>10−4) distributionsat the end of the simulation (t ≈ 5000 yr) for different models (the model as presented in Table 1 is reported near each quadrant) in the (x, 0, z) plane of 56Fe (red), 28Si (green), and 16O (blue). Black contours enclose the computational cells consisting of the original clump material by more than 50% (solid line) and 10% (dotted line). The white dashed line represents the projected position of the forward shock; see also online Movie 3, 4, 5, and 6 for an animated version.
Current usage metrics show cumulative count of Article Views (full-text article views including HTML views, PDF and ePub downloads, according to the available data) and Abstracts Views on Vision4Press platform.
Data correspond to usage on the plateform after 2015. The current usage metrics is available 48-96 hours after online publication and is updated daily on week days.
Initial download of the metrics may take a while.