Fig. B.1
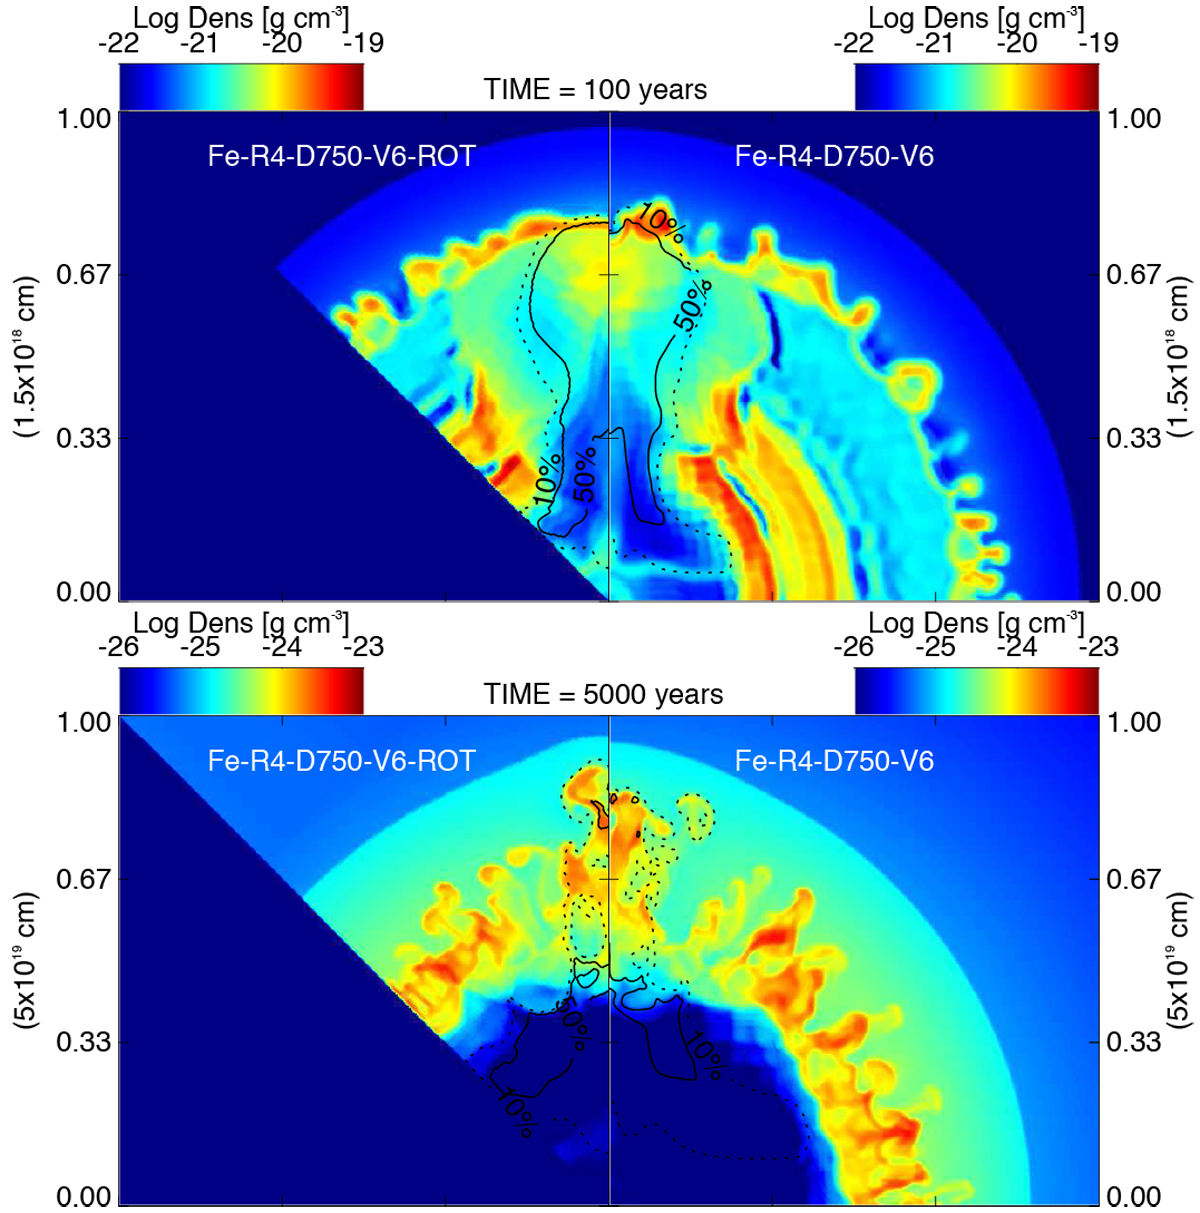
Density distribution maps in the (x, 0, z) plane at t ≈ 100 (upper panels) and t ≈ 5000 yr from the explosion (lower panels). Right: model Fe-R4-D750-V6 (see Table 1). Left: same model with the initial position of the clump located at 45° in the (x, 0, z) plane, namely Fe-R4-D750-V6-ROT. Left panels: the (x, 0, z) plane from the simulation is rotated to the z-axis for comparison, and thus the lower blue triangle is not part of the computational domain. We note the different scales in the upper and lower panels. The contours enclose the computational cells consisting of the original anisotropy material by more than 50% (continuous line) and 10% (dotted line).
Current usage metrics show cumulative count of Article Views (full-text article views including HTML views, PDF and ePub downloads, according to the available data) and Abstracts Views on Vision4Press platform.
Data correspond to usage on the plateform after 2015. The current usage metrics is available 48-96 hours after online publication and is updated daily on week days.
Initial download of the metrics may take a while.