Fig. A.1
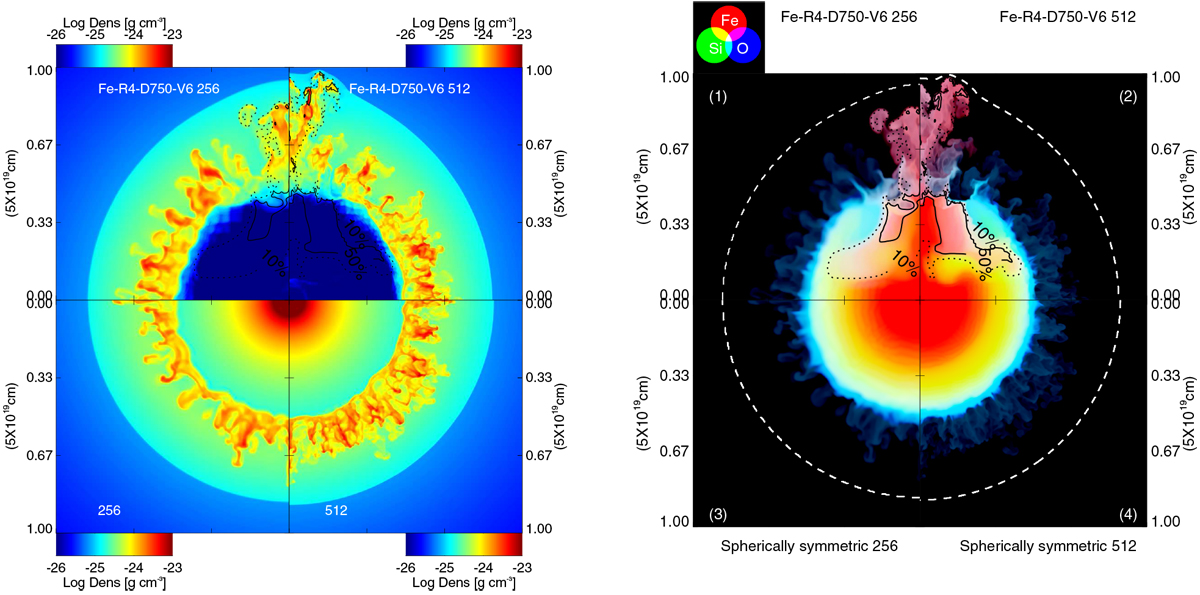
Left panel: density distributions in the (x, 0, z) plane at the end of simulation time for a SN explosion with a large-scale anisotropy (upper quadrants) (runs Fe-R4-D750-V6 and Fe-R4-D750-V6-512pt in Table 1) and for a spherically symmetric explosion (lower quadrants), at low resolution (2563 grid points; left quadrants) and high-resolution (5123 grid points; right quadrants). Right panel: same but for color-coded images of the logarithm of the mass fraction distributions of Fe (red), Si (green), O (blue). In the upper quadrants of each panel, the black contours enclose the computational cells consisting of the original anisotropy material by more than 10% (dotted line)and 50% (solid line). The white dashed line represents the approximate position of the forward shock.
Current usage metrics show cumulative count of Article Views (full-text article views including HTML views, PDF and ePub downloads, according to the available data) and Abstracts Views on Vision4Press platform.
Data correspond to usage on the plateform after 2015. The current usage metrics is available 48-96 hours after online publication and is updated daily on week days.
Initial download of the metrics may take a while.