Fig. 10
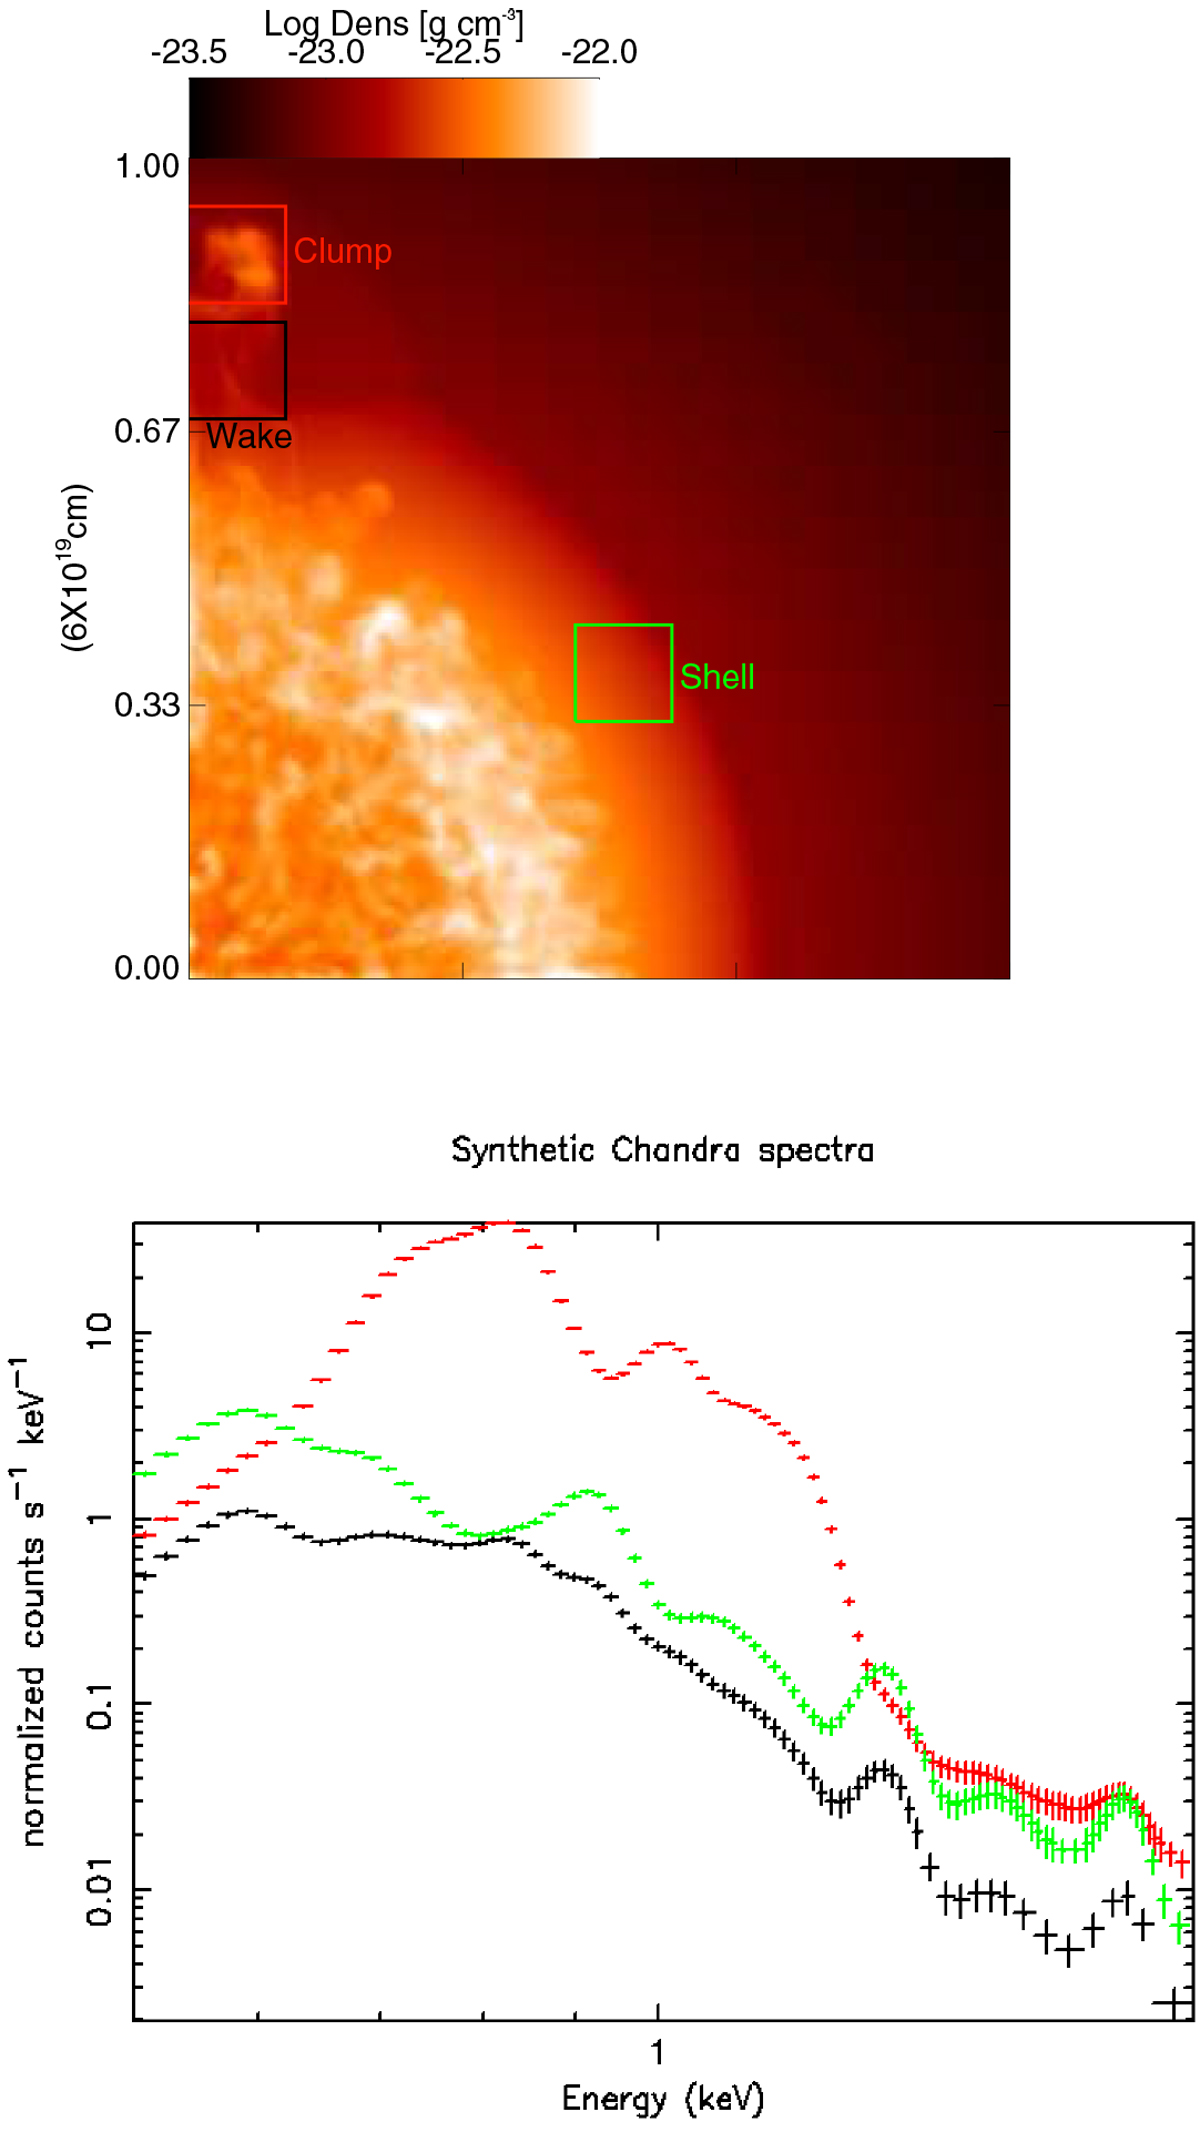
Upper panel: density distribution map integrated along the line of sight (in this case the y-axis) of the run Fe-R5-D750-V7, showing the regions chosen for the spectral synthesis: red for the anisotropy protruding the remnant outline (the clump), black for the wake of the anisotropy, and green for a region of the shell not affected by the anisotropy (the shell). Lower panel: X-ray Chandra ACIS-S synthetic spectra in the 0.5-2 keV energy band for the clump (red), the wake (black), and the shell (green).
Current usage metrics show cumulative count of Article Views (full-text article views including HTML views, PDF and ePub downloads, according to the available data) and Abstracts Views on Vision4Press platform.
Data correspond to usage on the plateform after 2015. The current usage metrics is available 48-96 hours after online publication and is updated daily on week days.
Initial download of the metrics may take a while.