Fig. 7.
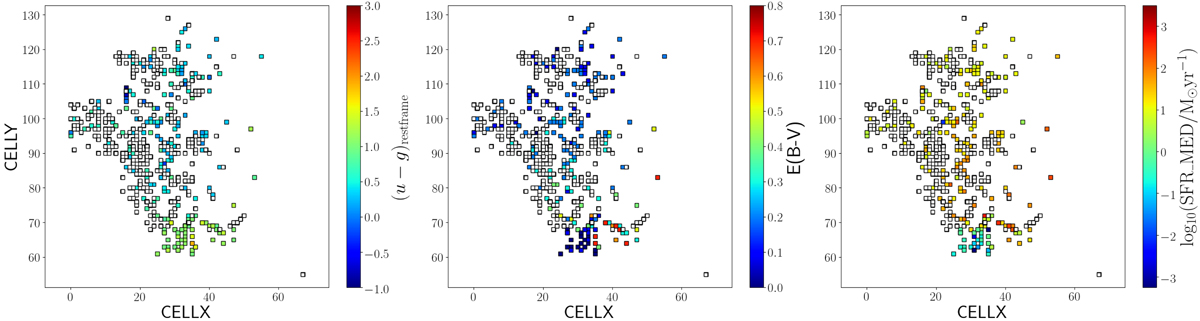
Representation of SOM cells targeted by the KMOS programme. The cells filled with high-quality spectroscopic redshift measurements are coloured in white. Left: cells are colour-coded according to the restframe (u − g) colour. Middle: cells are colour-coded according to the best fit E(B − V) resulting from SED fitting analysis on the photometric sample. Right: cells are colour-coded according to the best fit SFR resulting from SED fitting analysis on the photometric sample.
Current usage metrics show cumulative count of Article Views (full-text article views including HTML views, PDF and ePub downloads, according to the available data) and Abstracts Views on Vision4Press platform.
Data correspond to usage on the plateform after 2015. The current usage metrics is available 48-96 hours after online publication and is updated daily on week days.
Initial download of the metrics may take a while.