Fig. 5.
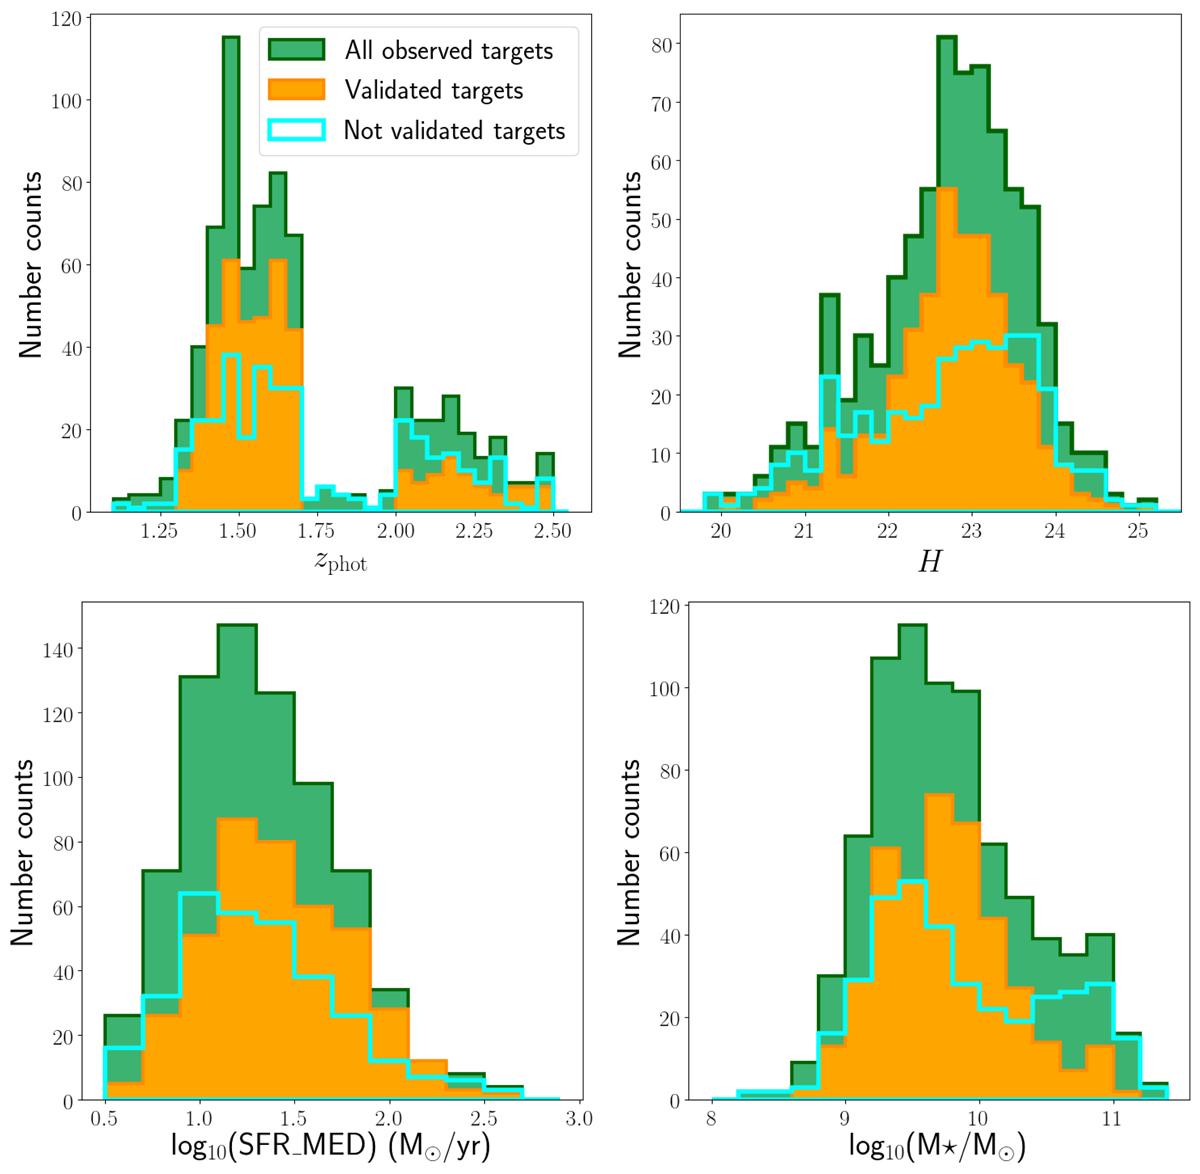
Top left: histogram of zphot of individual galaxies from the literature. Top right: histogram of the observed H total magnitude for all observed targets (green filled), for those with high-quality spectroscopic redshifts (validated targets; orange filled) and for those that could not be assigned a spectroscopic redshift (not validated targets; open blue line). Bottom left: histogram of the SFR derived from SED fitting for the same samples. Bottom right: histogram of the stellar mass derived from SED fitting for the same samples.
Current usage metrics show cumulative count of Article Views (full-text article views including HTML views, PDF and ePub downloads, according to the available data) and Abstracts Views on Vision4Press platform.
Data correspond to usage on the plateform after 2015. The current usage metrics is available 48-96 hours after online publication and is updated daily on week days.
Initial download of the metrics may take a while.