Fig. 4.
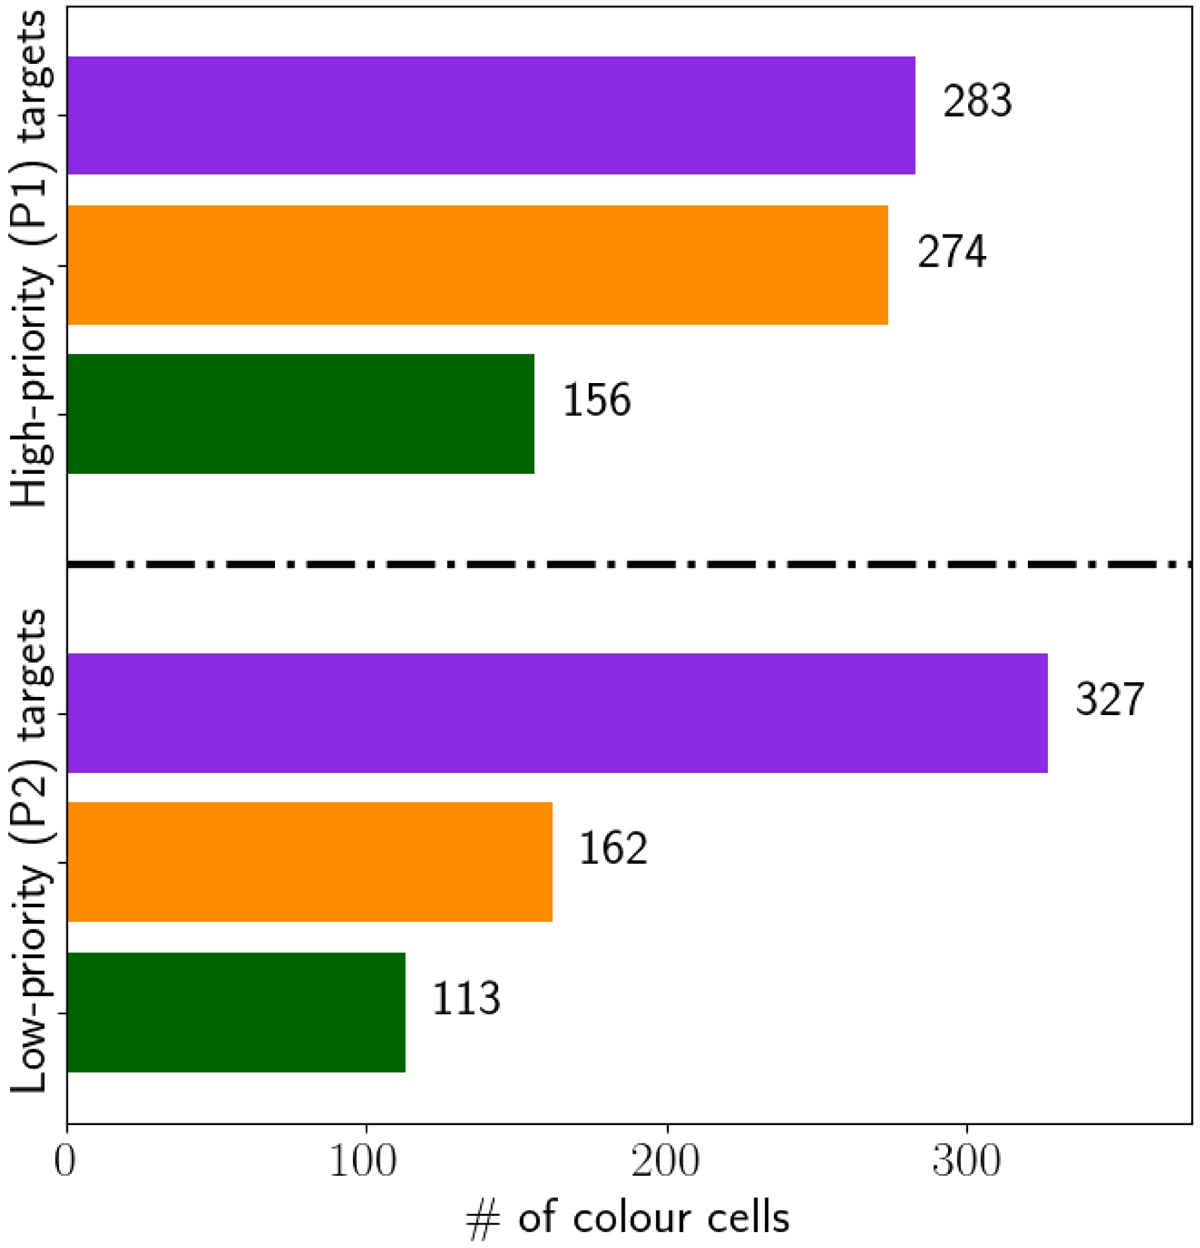
Success rate in terms of number of cells filled with high-quality zspec. The observed targets are divided into high (P1) and low (P2) priority targets according to the prioritisation scheme described in Sect. 3.2. Purple horizontal bars represent the total number of undersampled cells requiring zspec measurements; orange histograms represent the number of cells targeted by all KMOS observations, and green histograms represent the number of cells that provided accurate zspec measurements.
Current usage metrics show cumulative count of Article Views (full-text article views including HTML views, PDF and ePub downloads, according to the available data) and Abstracts Views on Vision4Press platform.
Data correspond to usage on the plateform after 2015. The current usage metrics is available 48-96 hours after online publication and is updated daily on week days.
Initial download of the metrics may take a while.