Fig. 12.
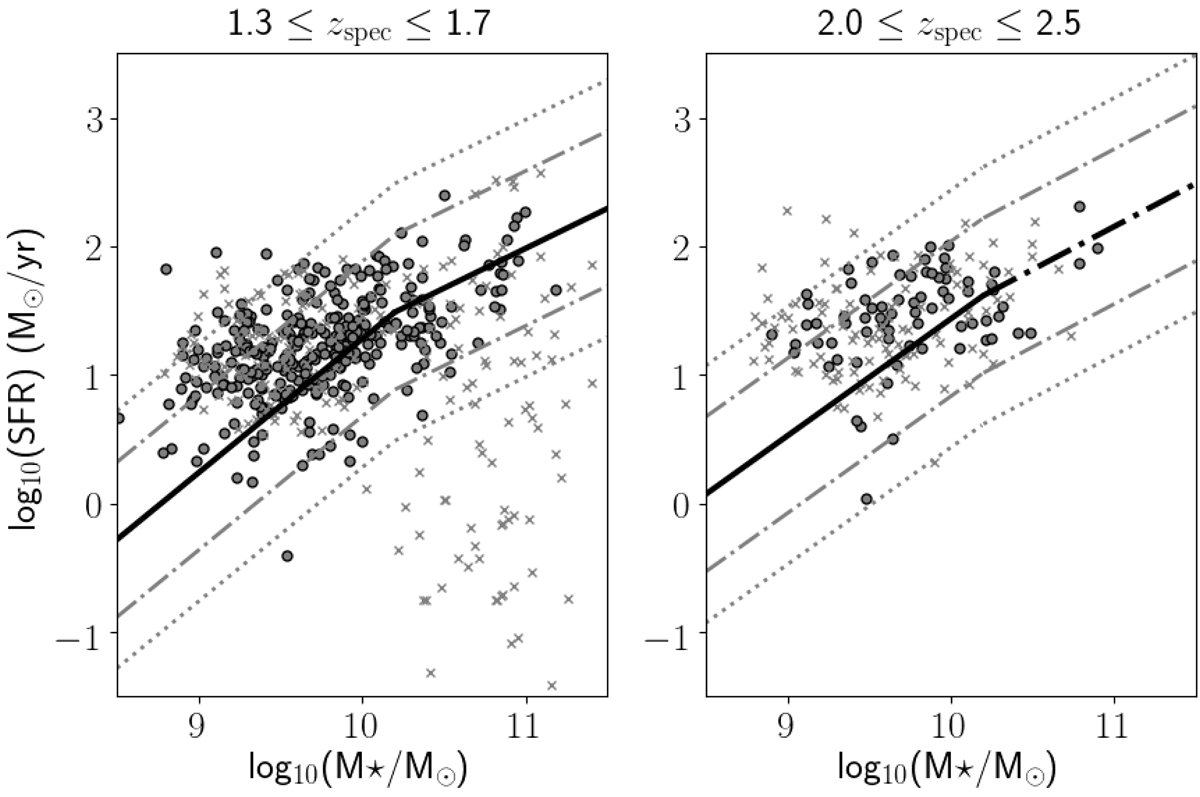
(Hα-based) SFR (grey circles) and (SED fitting based) SFR (grey crosses) vs stellar mass. Left panel: lower redshift targets observed in H-band in the three surveys considered in the scientific analysis prensented here, right panel: same for higher redshift K-band targets. The black solid lines are the best fit to the star-forming main sequence (MS) in the same redshift range from Whitaker et al. (2014); the dashed and dotted lines show 4× and 10× above and below the MS and bracket the distribution of the data points of the 3D-HST galaxies (see Fig. 7 in Wisnioski et al. 2019).
Current usage metrics show cumulative count of Article Views (full-text article views including HTML views, PDF and ePub downloads, according to the available data) and Abstracts Views on Vision4Press platform.
Data correspond to usage on the plateform after 2015. The current usage metrics is available 48-96 hours after online publication and is updated daily on week days.
Initial download of the metrics may take a while.