Fig. 11.
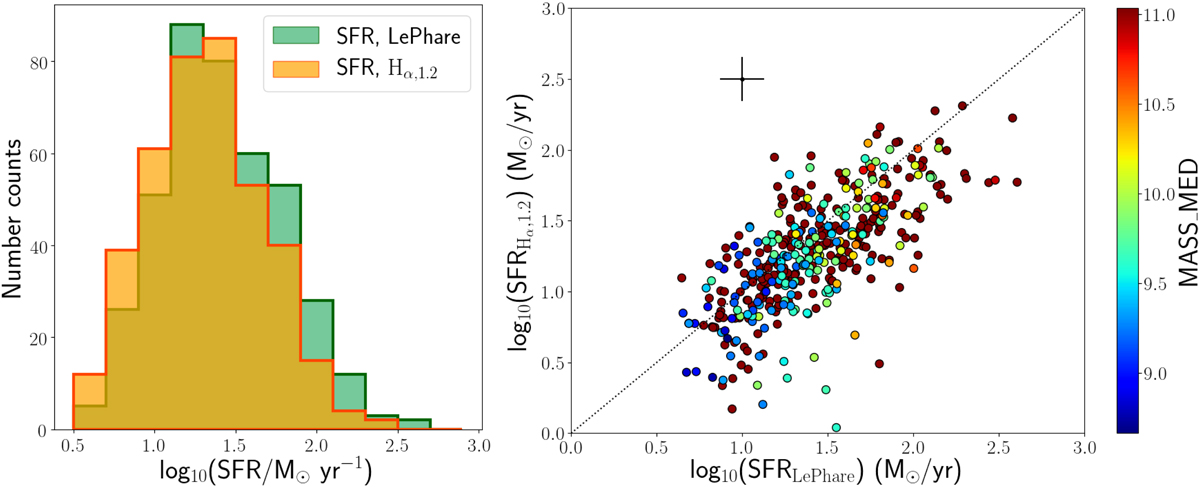
Left: histogram of SFR derived from aperture Hα fluxes, and that estimated from LePhare SED fitting. Right: comparison between the Hα and SED-fitting SFRs, colour-coded by galaxy stellar mass. The black dashed line is the one-to-one correlation. The plot also shows the typical error on the SFR from LePhare (horizontal black error bar, calculated using the SFR_INF and SFR_SUP released in the catalogue) and on the Hα SFR (considering a typical uncertainty of 10% on the flux measurement, see Wisnioski et al. 2019).
Current usage metrics show cumulative count of Article Views (full-text article views including HTML views, PDF and ePub downloads, according to the available data) and Abstracts Views on Vision4Press platform.
Data correspond to usage on the plateform after 2015. The current usage metrics is available 48-96 hours after online publication and is updated daily on week days.
Initial download of the metrics may take a while.