Fig. 10.
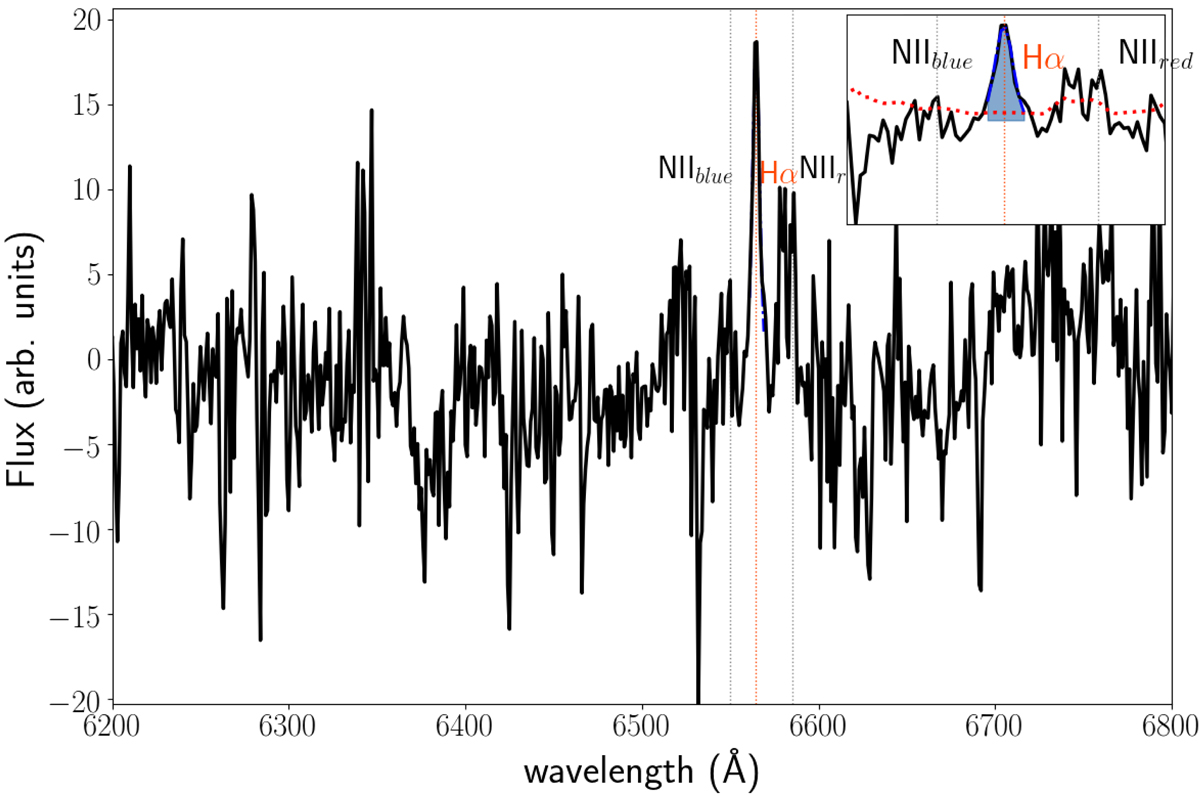
One-dimensional spectrum estimated by summing up all the spaxel spectra in the ![]() radius aperture, corrected for their peculiar velocity according to the aperture-corrected velocity map described in the main text (Sect. 7.2). The same galaxy as the one shown in Fig. 9 is used. The main panel shows a wavelength cut of the whole 1D sum spectrum around the Hα and NII lines, which are indicated with orange and black dashed lines, respectively. The inset panel is a zoom-in around the Hα peak and shows the integral of the line that is estimated for measuring the total flux (light blue area) weighted by the noise (red dashed line), and it is also continuum corrected.
radius aperture, corrected for their peculiar velocity according to the aperture-corrected velocity map described in the main text (Sect. 7.2). The same galaxy as the one shown in Fig. 9 is used. The main panel shows a wavelength cut of the whole 1D sum spectrum around the Hα and NII lines, which are indicated with orange and black dashed lines, respectively. The inset panel is a zoom-in around the Hα peak and shows the integral of the line that is estimated for measuring the total flux (light blue area) weighted by the noise (red dashed line), and it is also continuum corrected.
Current usage metrics show cumulative count of Article Views (full-text article views including HTML views, PDF and ePub downloads, according to the available data) and Abstracts Views on Vision4Press platform.
Data correspond to usage on the plateform after 2015. The current usage metrics is available 48-96 hours after online publication and is updated daily on week days.
Initial download of the metrics may take a while.