Fig. 3.
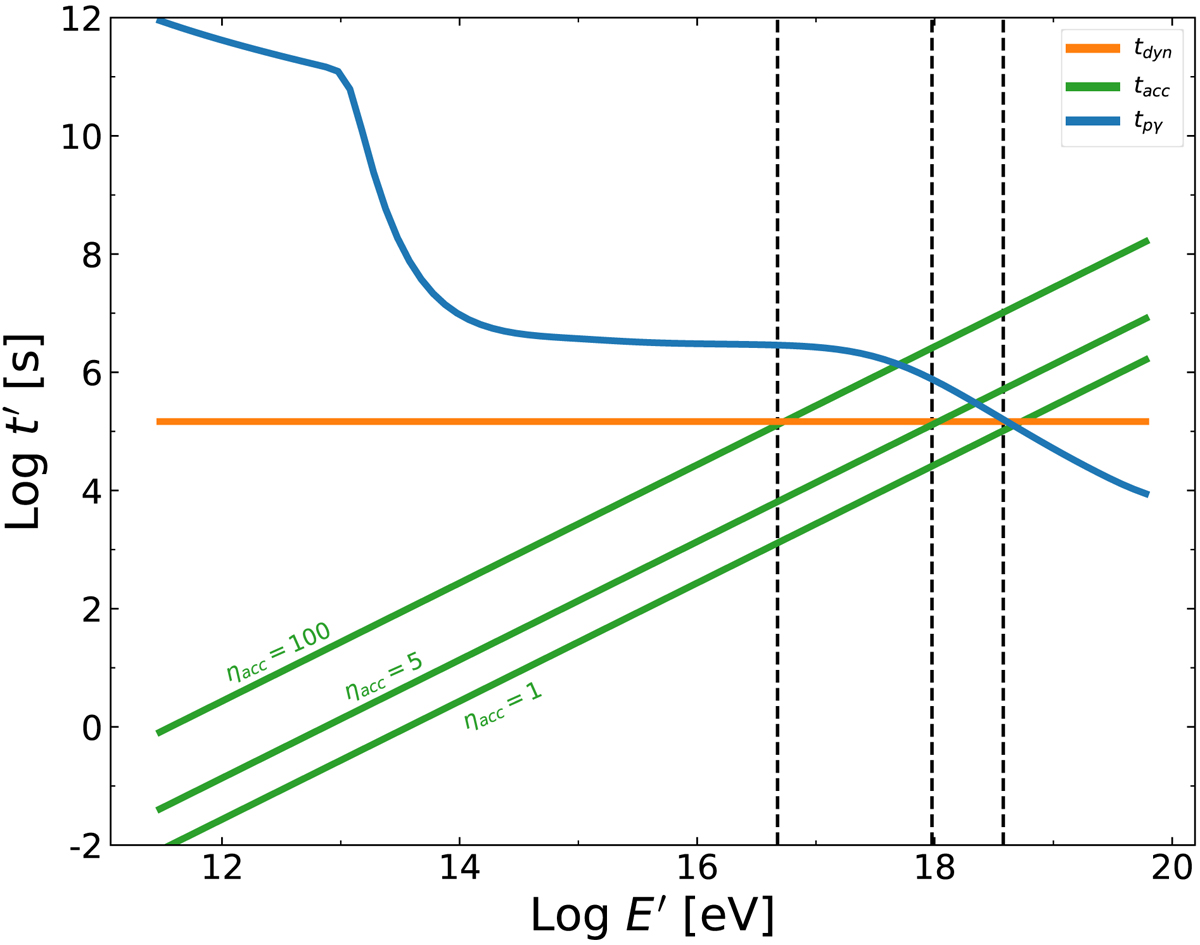
Acceleration and cooling timescales (measured in the jet frame) expected for high-energy protons for an intermediate luminosity bin, 1046 erg s−1 < Lγ < 1047 erg s−1. The blue line shows the photomeson timescale tpγ. Green lines show an estimate of the acceleration timescale for three values of the acceleration efficiency ηacc. The orange horizontal line is the adiabatic timescale. All quantities are expressed in the emission region reference frame.
Current usage metrics show cumulative count of Article Views (full-text article views including HTML views, PDF and ePub downloads, according to the available data) and Abstracts Views on Vision4Press platform.
Data correspond to usage on the plateform after 2015. The current usage metrics is available 48-96 hours after online publication and is updated daily on week days.
Initial download of the metrics may take a while.