Fig. 26.
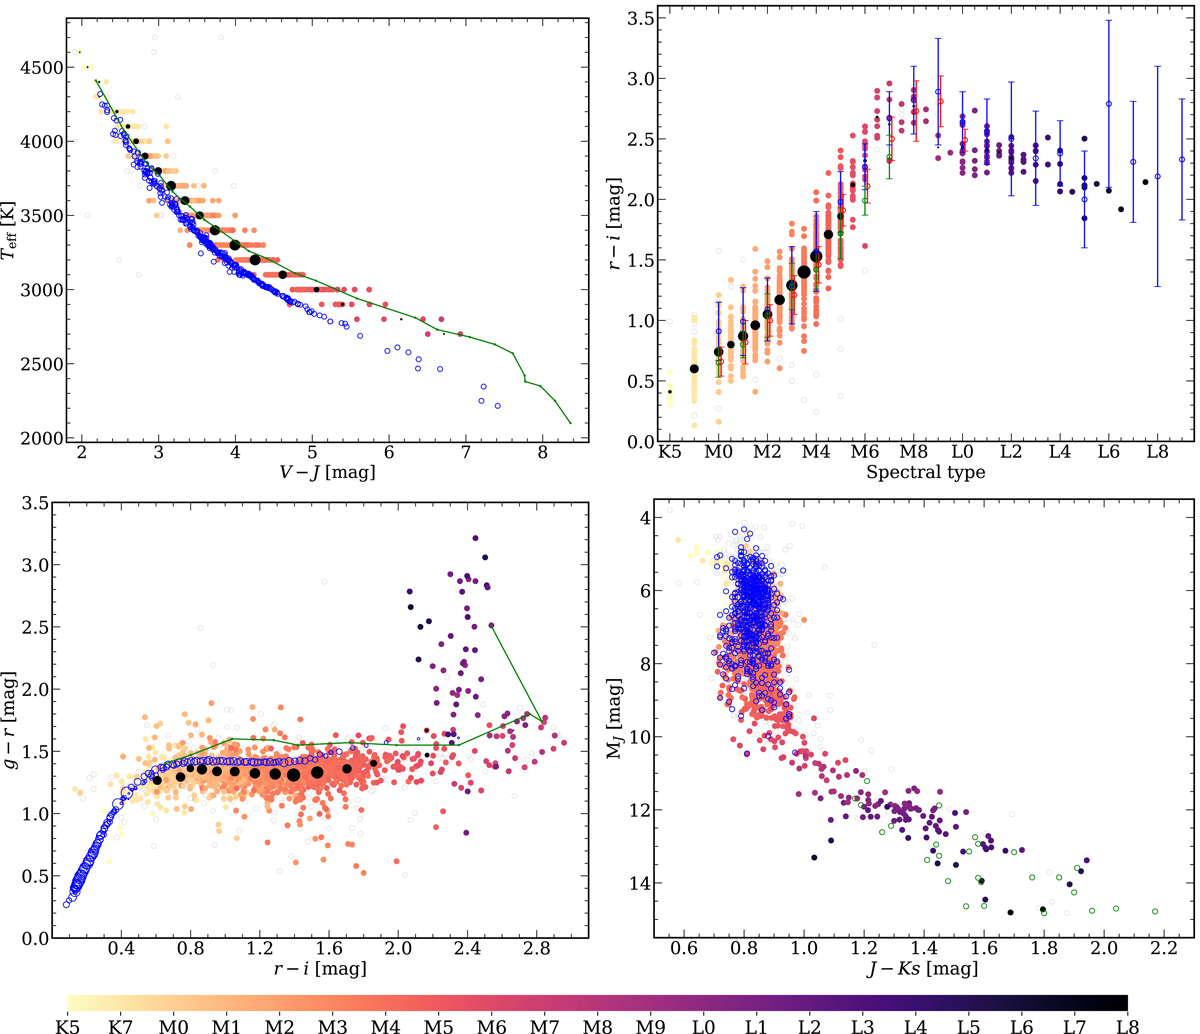
Top left: Teff vs. V − J. The blue empty circles and green line are data from Casagrande et al. (2008) and Pecaut & Mamajek (2013), respectively. Black filled circles are the mean colours from 2700 K to 4600 K in our sample, with a size proportional to the number of stars. Top right: r′−i′ vs. spectral type. Open circles are the mean colours of Hawley et al. (2002, blue), Bochanski et al. (2007, “inactive” colours, green), and West et al. (2008, red). Black filled circles are the mean colours from K5 V to L2 in our sample, taken from Table A.2, with a size proportional to the number of stars. The error bars are the standard deviation (Hawley et al. 2002; Bochanski et al. 2007) and the intrinsic scatter of the stellar locus (West et al. 2008). Bottom left: g′−r′ vs. r′−i′. Black filled circles are the mean colours from K5 V to L2 in our sample, taken from Table A.2, with a size proportional to the number of stars. Blue empty circles are the mean colours by Davenport et al. (2014), with a size proportional to the numbers of stars, and the green line links the mean “inactive” colours by Bochanski et al. (2007) for spectral types M0 V to L0. Bottom right: MJ vs. J − Ks. Green and blue empty circles are data from Knapp et al. (2004) and Lépine et al. (2013), respectively. In the four panels, the stars in our sample are colour-coded by spectral type, and the discarded stars are plotted with grey empty circles.
Current usage metrics show cumulative count of Article Views (full-text article views including HTML views, PDF and ePub downloads, according to the available data) and Abstracts Views on Vision4Press platform.
Data correspond to usage on the plateform after 2015. The current usage metrics is available 48-96 hours after online publication and is updated daily on week days.
Initial download of the metrics may take a while.