Fig. 24.
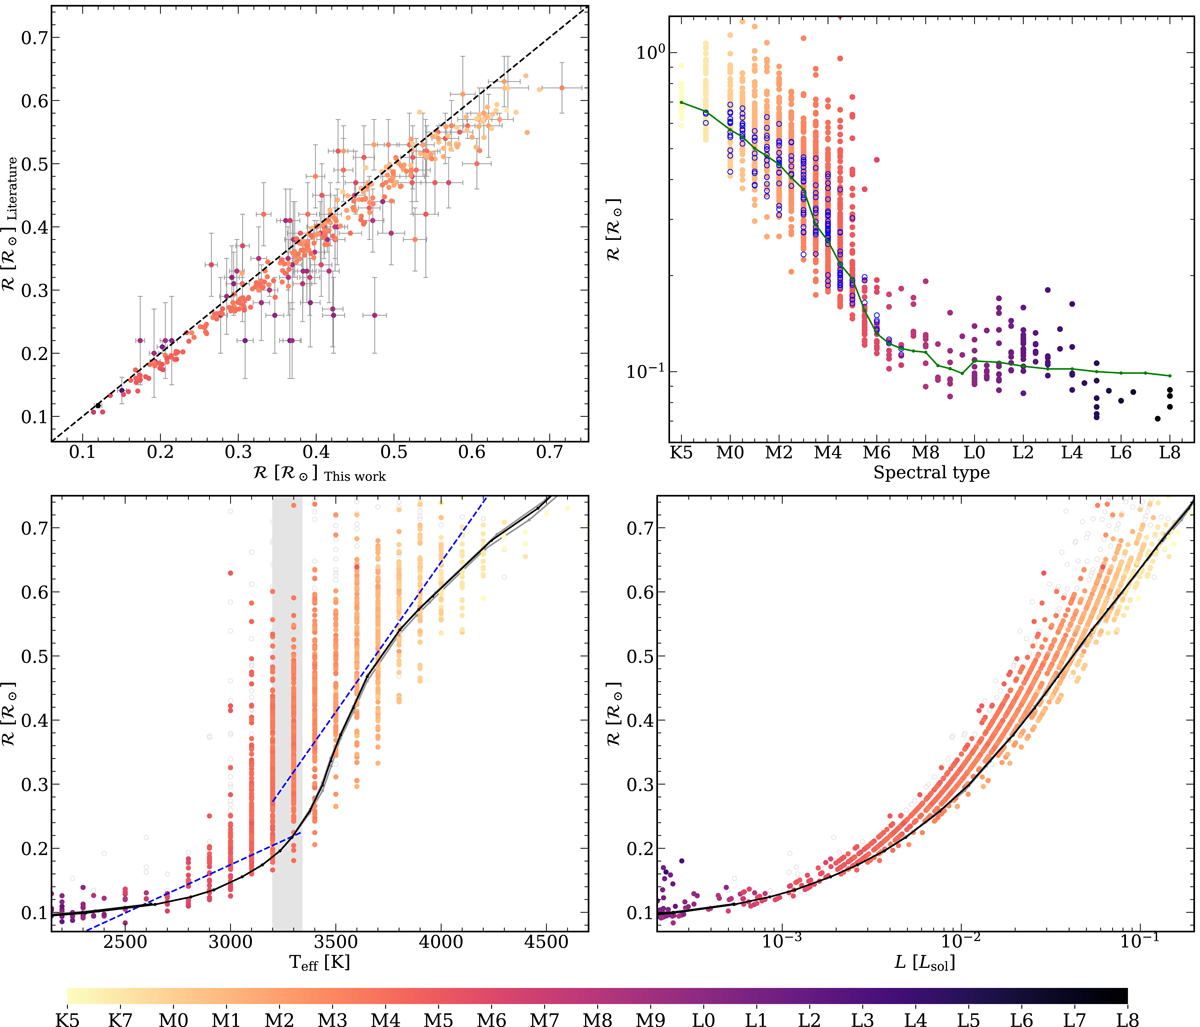
Four representative diagrams involving ℛ. In the four panels our investigated stars are represented with filled circles colour-coded by spectral type. Top left: comparison of ℛ from this work and from the literature, including Schweitzer et al. 2019 (with symbol-size error bars). Top right: individual (coloured points) and median (black circles) values of ℛ as a function of the spectral sequence shown in Table 6. The green line marks the median values from Pecaut & Mamajek (2013) and the blue circles are stars from Mann et al. (2015). Bottom left: ℛ vs. Teff. The black and grey solid lines are the NextGen isochrones of the Lyon group for 1.0, 4.0, and 8.0 Ga (overlapping), the blue dashed lines are the linear fittings from Rabus et al. (2019), and the grey shaded area is the region where they reported a possible discontinuity. Bottom right: ℛ vs. L. The black solid lines are the same isochrones as in the bottom left panel.
Current usage metrics show cumulative count of Article Views (full-text article views including HTML views, PDF and ePub downloads, according to the available data) and Abstracts Views on Vision4Press platform.
Data correspond to usage on the plateform after 2015. The current usage metrics is available 48-96 hours after online publication and is updated daily on week days.
Initial download of the metrics may take a while.