Fig. 21.
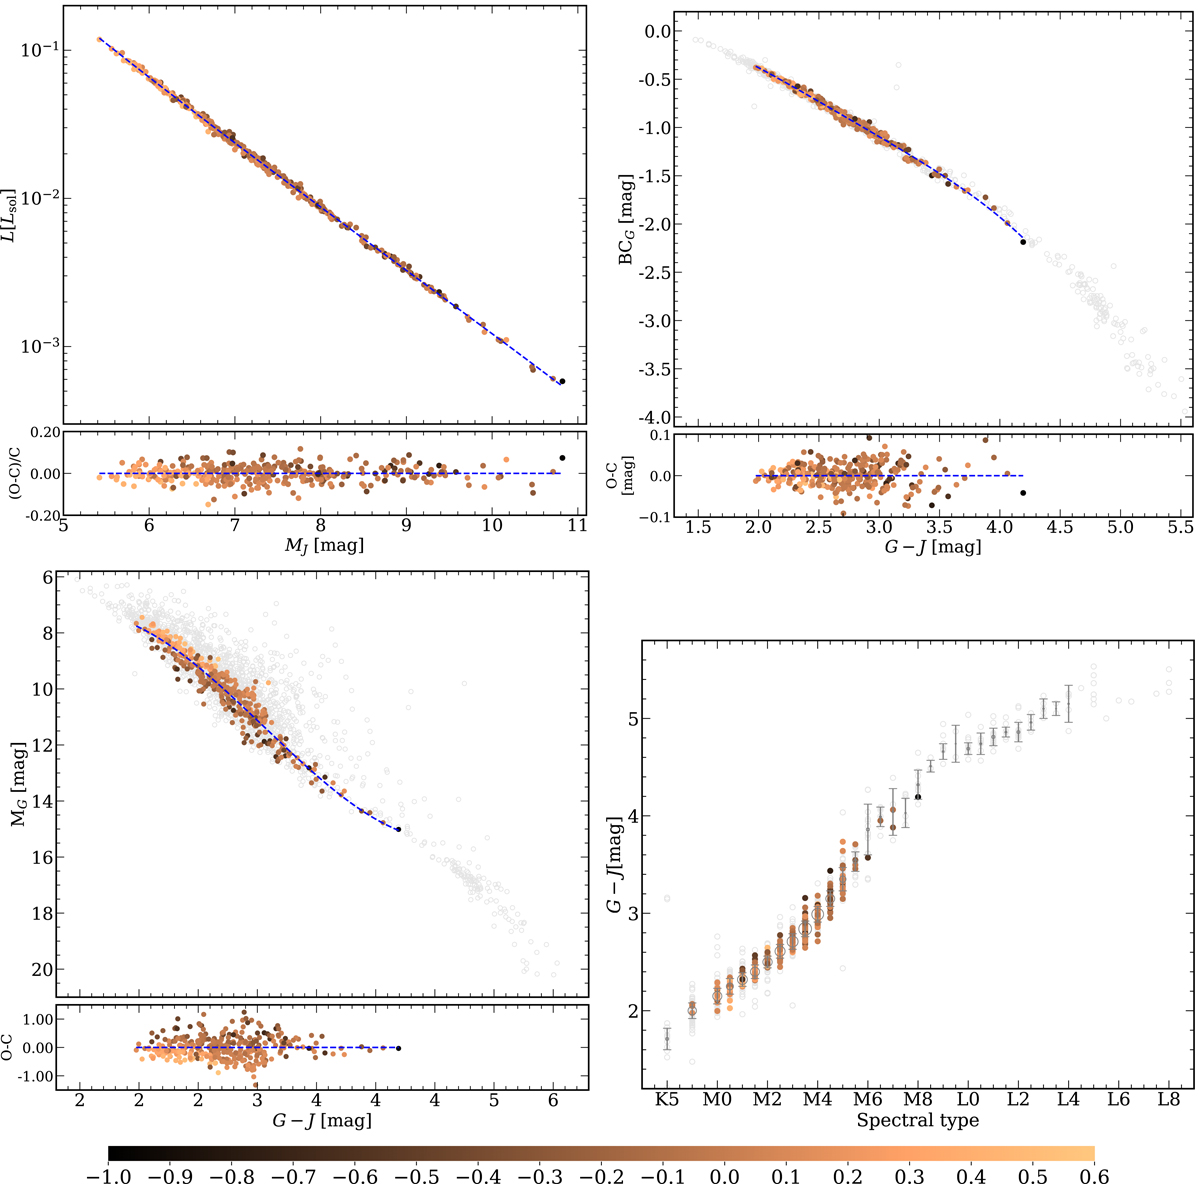
Revisiting empirical relations in Table 5 for stars with [Fe/H] values published in the literature. Top left: LVOSA, BT − Settl CIFIST vs. MJ. Top right: BCG vs. G − J. Bottom left: MG vs. G − J. The blue dashed lines in the three panels represent new 3-, 4-, and 3-degree polynomial fits, respectively. Bottom right: G − J vs. spectral type. The grey circles represent the mean values with a symbol size proportional to the sample size in each type.
Current usage metrics show cumulative count of Article Views (full-text article views including HTML views, PDF and ePub downloads, according to the available data) and Abstracts Views on Vision4Press platform.
Data correspond to usage on the plateform after 2015. The current usage metrics is available 48-96 hours after online publication and is updated daily on week days.
Initial download of the metrics may take a while.