Fig. 20.
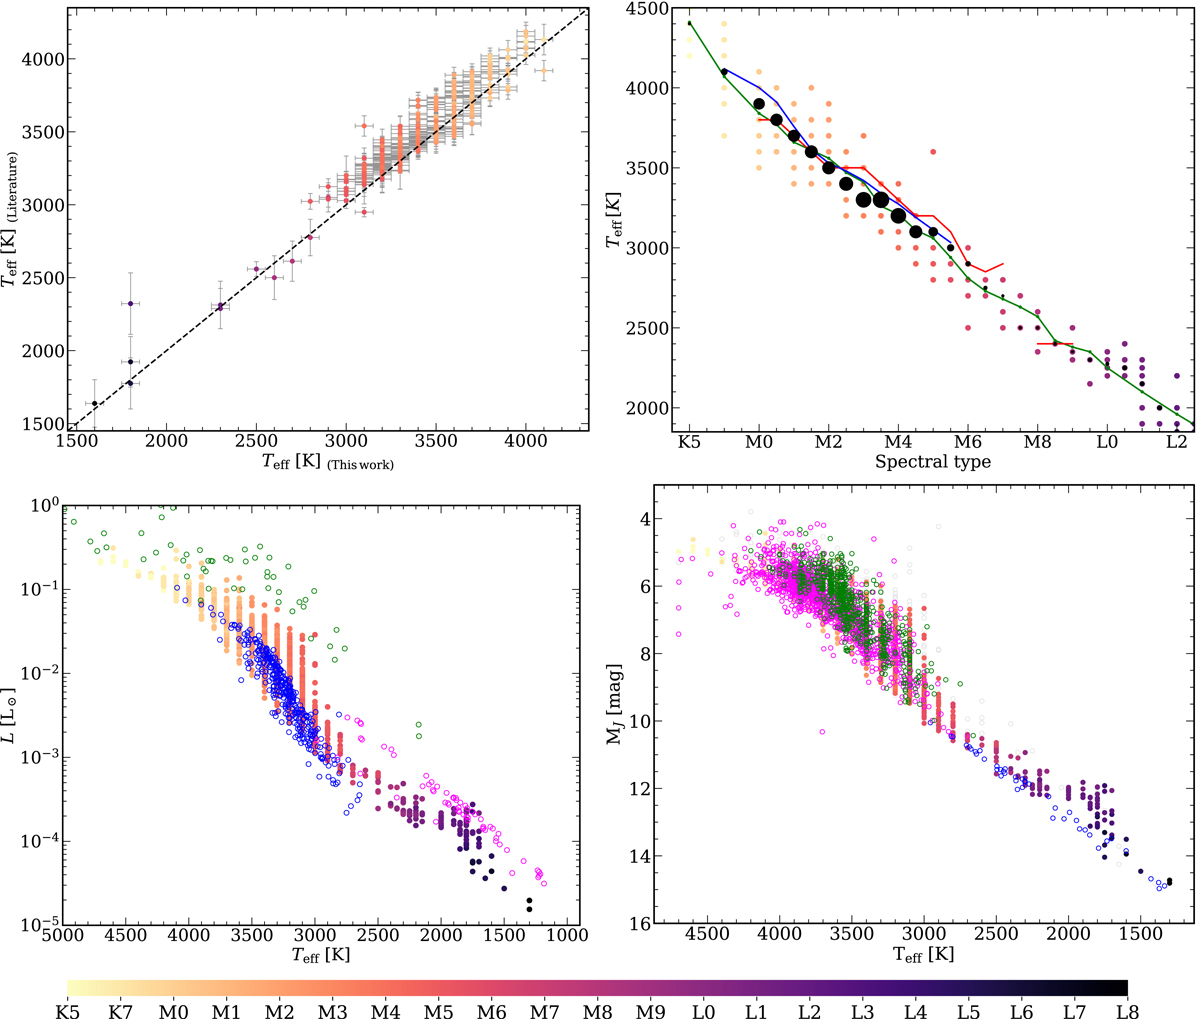
Four representative diagrams involving Teff. In the four panels our investigated stars are represented with filled circles colour-coded by spectral type. Top left: comparison of Teff from this work and from the literature. Top right: individual (coloured points) and median (black circles) values of Teff as a function of the spectral sequence shown in Table 6. The size of the black circles is proportional to the number of stars per spectral type. The green, red, and blue lines mark the mean values tabulated by Pecaut & Mamajek (2013), Rajpurohit et al. (2018a), and Passegger et al. (2019), respectively. Bottom left: L vs. Teff. As a comparison we also plot pre-main sequence stars with BT-Settl model fitting from Pecaut & Mamajek (2013, green empty circles), M dwarfs in the MEarth sample with stellar parameters from Newton et al. (2015, blue empty circles, inferred from the pseudo-equivalent width of Mg I near-infrared lines), and high-confidence moving group members from Faherty et al. (2016, magenta empty circles) with parameters computed as in Filippazzo et al. (2015). Bottom right: J-band absolute magnitude vs. Teff. As a comparison we also plot the samples of Dahn et al. (2002, blue open circles), Lépine et al. (2013, green open circles), and Gaidos & Mann (2014, magenta empty circles).
Current usage metrics show cumulative count of Article Views (full-text article views including HTML views, PDF and ePub downloads, according to the available data) and Abstracts Views on Vision4Press platform.
Data correspond to usage on the plateform after 2015. The current usage metrics is available 48-96 hours after online publication and is updated daily on week days.
Initial download of the metrics may take a while.