Fig. 10.
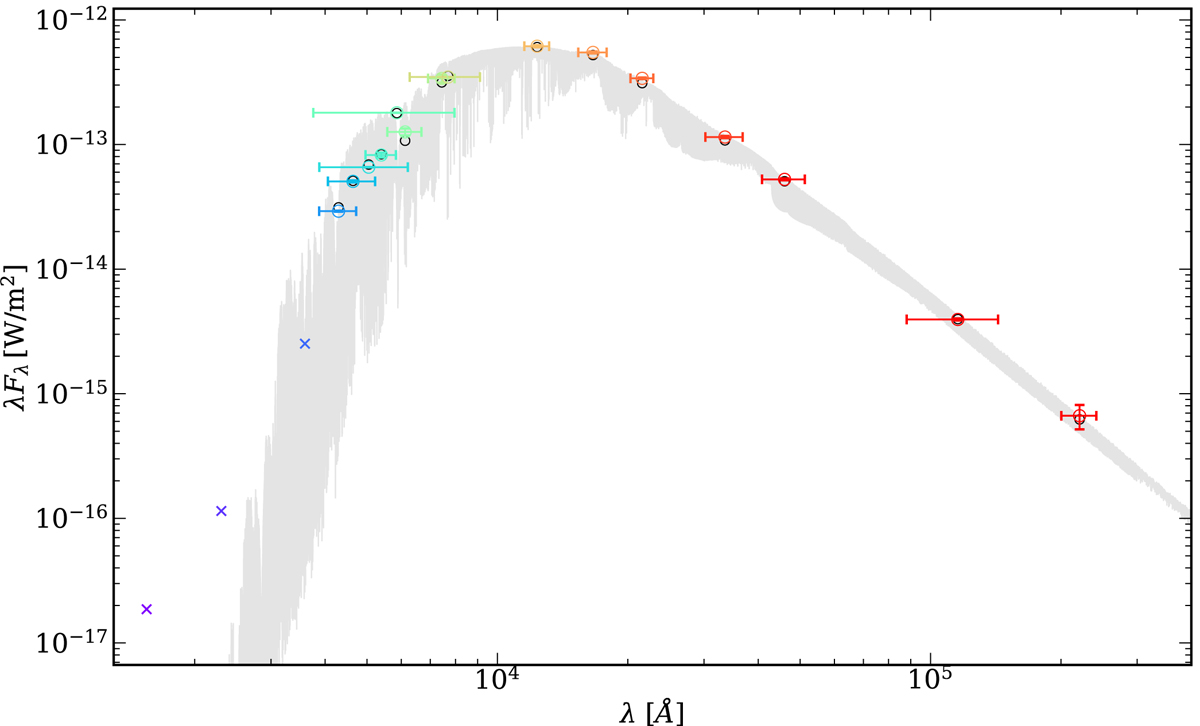
Spectral energy distribution of LP 167–071 (J10384+485, M3.0 V). The empirical fluxes (coloured empty circles, following the same colour scheme as in Fig. 5) are overimposed on the best-fitting BT-Settl CIFIST spectrum (grey; Teff = 3300 K and log g = 5.5). The modelled fluxes are depicted as grey empty circles. Photometric data in the ultraviolet are shown as crosses, and are not considered in the modelling. Horizontal bars represent the effective widths of the bandpasses, while vertical bars (visible only for relatively large values) represent the flux uncertainty derived from the magnitude and parallax errors.
Current usage metrics show cumulative count of Article Views (full-text article views including HTML views, PDF and ePub downloads, according to the available data) and Abstracts Views on Vision4Press platform.
Data correspond to usage on the plateform after 2015. The current usage metrics is available 48-96 hours after online publication and is updated daily on week days.
Initial download of the metrics may take a while.