Fig. 3
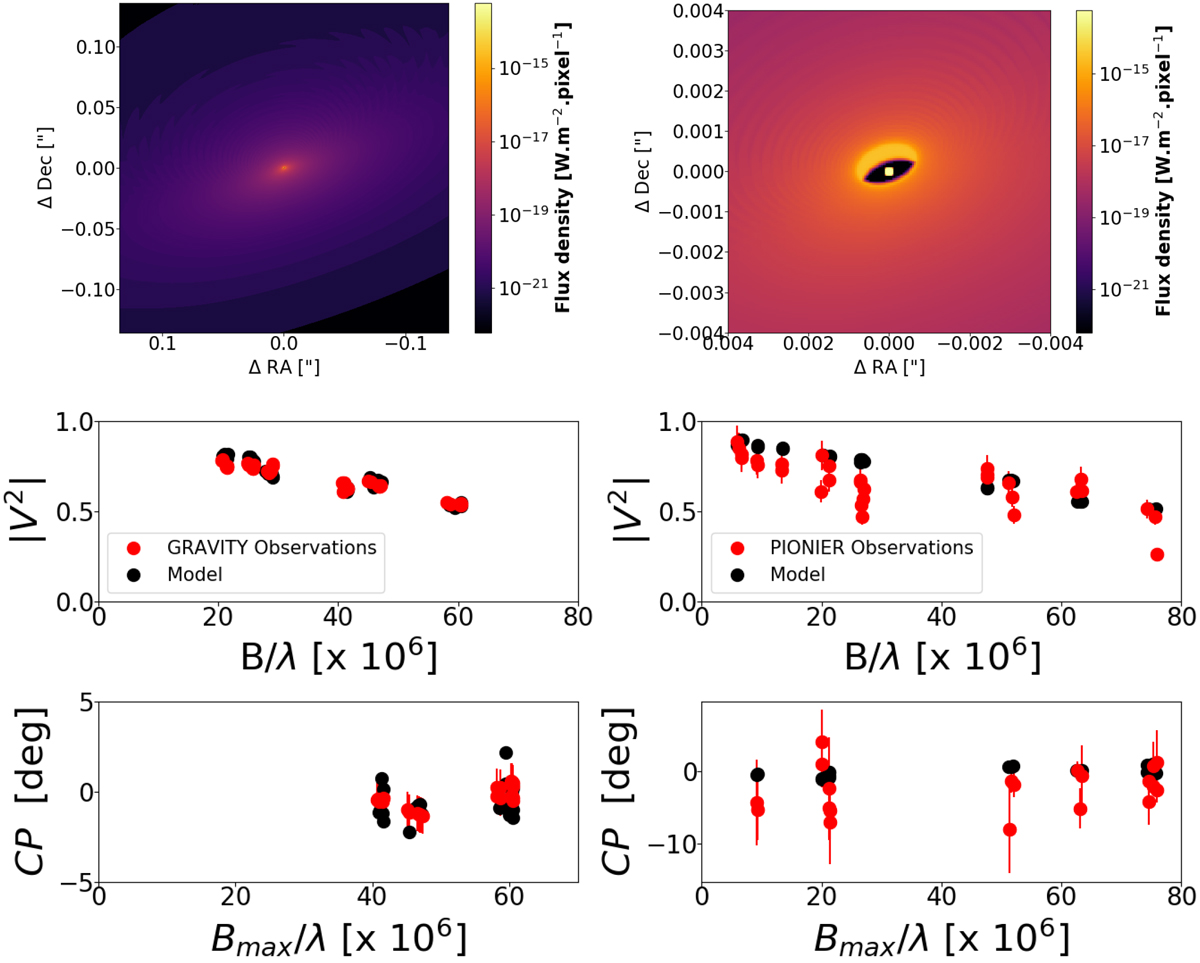
Top: intensity maps produced by MCFOST for our model M50 of RY Lup in the K band for the whole disk (left) and zoom in at the milliarcsecond scale of the central region (right). Middle: observed squared visibilities (red circles) with GRAVITY (left) and PIONIER (right) compared with the visibilities computed with our model M50 (black circles). Bottom: observed closure phases (red circles) with GRAVITY (left) and PIONIER (right) compared with the closure phases computed with our model M50 (black circles).
Current usage metrics show cumulative count of Article Views (full-text article views including HTML views, PDF and ePub downloads, according to the available data) and Abstracts Views on Vision4Press platform.
Data correspond to usage on the plateform after 2015. The current usage metrics is available 48-96 hours after online publication and is updated daily on week days.
Initial download of the metrics may take a while.