Fig. 2
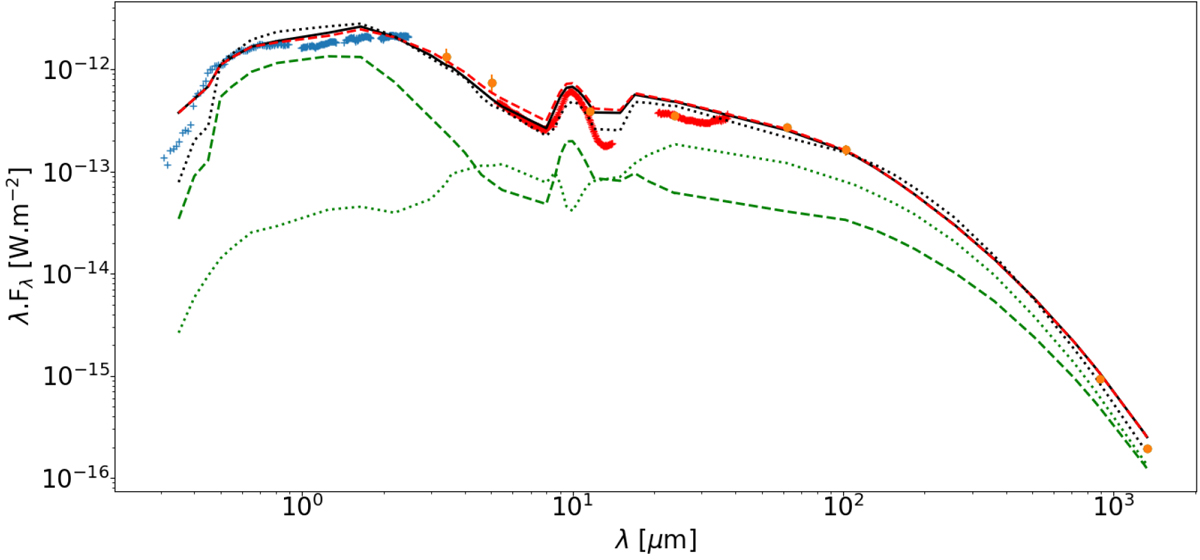
Spectral energy distributions corresponding to our models of RY Lup: M50 for an inclination of 50° with rin = 0.12 au (black solid line) and rin = 0.17 au (red dashed line), and M70 for an inclination of 70° (black dotted-line) compared with the photometric measurements (orange circles; Table 2), the X-shooter spectrum (blue crosses), and the Spitzer/IRS spectrum (red plus). The green lines display the SEDs calculated with the disk parameters of M50 (dashed line) and of M70 (dotted line) models but using the stellar parameters (Teff, L*), and the inclination of 75° used by Langlois et al. (2018). See text for details.
Current usage metrics show cumulative count of Article Views (full-text article views including HTML views, PDF and ePub downloads, according to the available data) and Abstracts Views on Vision4Press platform.
Data correspond to usage on the plateform after 2015. The current usage metrics is available 48-96 hours after online publication and is updated daily on week days.
Initial download of the metrics may take a while.