Fig. B.1
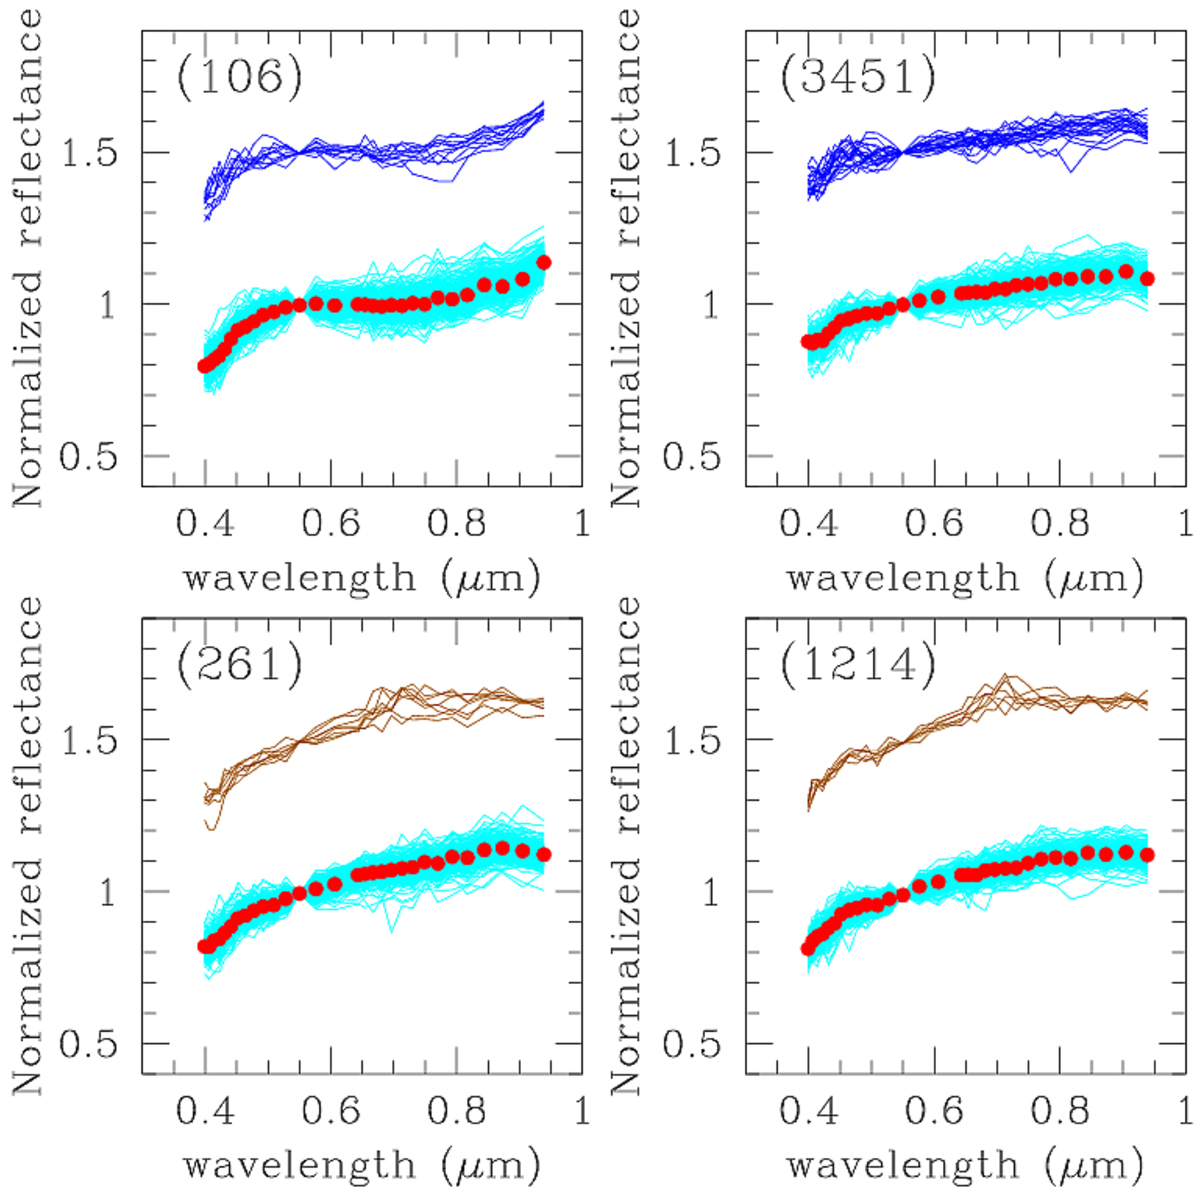
Parent spectra (red dots) and randomly generated clones (continues lines) for the asteroids (106), (3451), (261), and (1214). All reflectances are normalised at the same wavelength of 0.55 μm. The clones of each parent spectrum are always found to contribute mostly to one obtained taxonomic class, and are plotted superposed onto the parent spectrum. Clones found to contribute to other classes are plotted with a shift of + 0.5 in normalised spectral reflectance to distinguish them. The adopted colours in this and the following Figs. B.2–B.8 have been chosen in such a way that each obtained taxonomic class is characterised by the same colour in all plots. The exceptions are given by clones of parent spectra producing clones all belonging to one class only. These cases are shown in dark green in Fig. B.8.
Current usage metrics show cumulative count of Article Views (full-text article views including HTML views, PDF and ePub downloads, according to the available data) and Abstracts Views on Vision4Press platform.
Data correspond to usage on the plateform after 2015. The current usage metrics is available 48-96 hours after online publication and is updated daily on week days.
Initial download of the metrics may take a while.