Free Access
Fig. 8
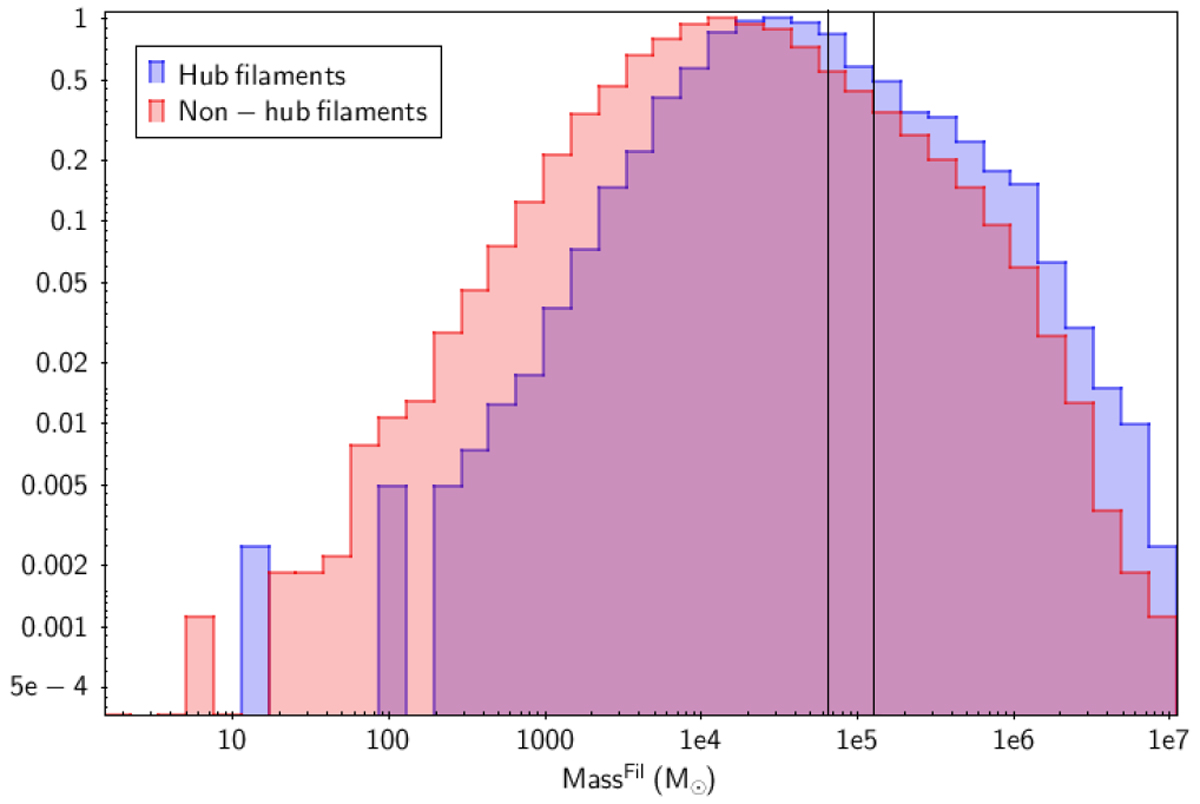
Histogram (normalised by maximum y-value) of filament masses in HFS and non-HFS samples, showing the effect of massive filaments in HFSs. The vertical lines represent the mean values.
Current usage metrics show cumulative count of Article Views (full-text article views including HTML views, PDF and ePub downloads, according to the available data) and Abstracts Views on Vision4Press platform.
Data correspond to usage on the plateform after 2015. The current usage metrics is available 48-96 hours after online publication and is updated daily on week days.
Initial download of the metrics may take a while.