Fig. 5
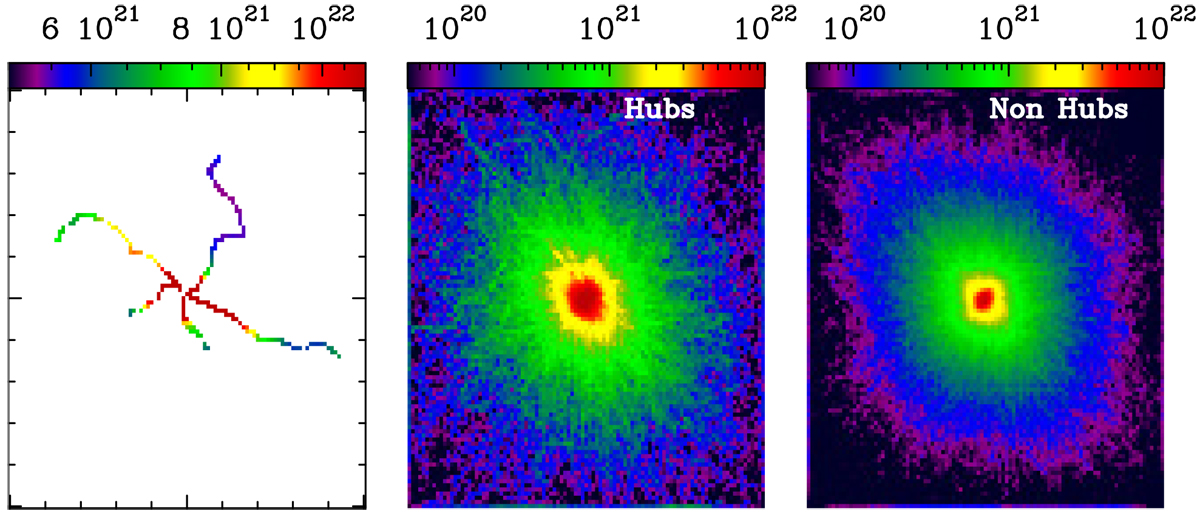
Computing the column density profile for HFSs: the column density map of each target is masked by the skeleton (left panel) and then averaged for all target hubs (middle panel) and non-hubs (right panel). The radial profile shown in Fig. 11 is computed using these average images for different evolutionary groups. The example shown here is for the group of proto-stellar hubs and non-hubs, and the units of the colour bar are cm−2.
Current usage metrics show cumulative count of Article Views (full-text article views including HTML views, PDF and ePub downloads, according to the available data) and Abstracts Views on Vision4Press platform.
Data correspond to usage on the plateform after 2015. The current usage metrics is available 48-96 hours after online publication and is updated daily on week days.
Initial download of the metrics may take a while.