Fig. 11
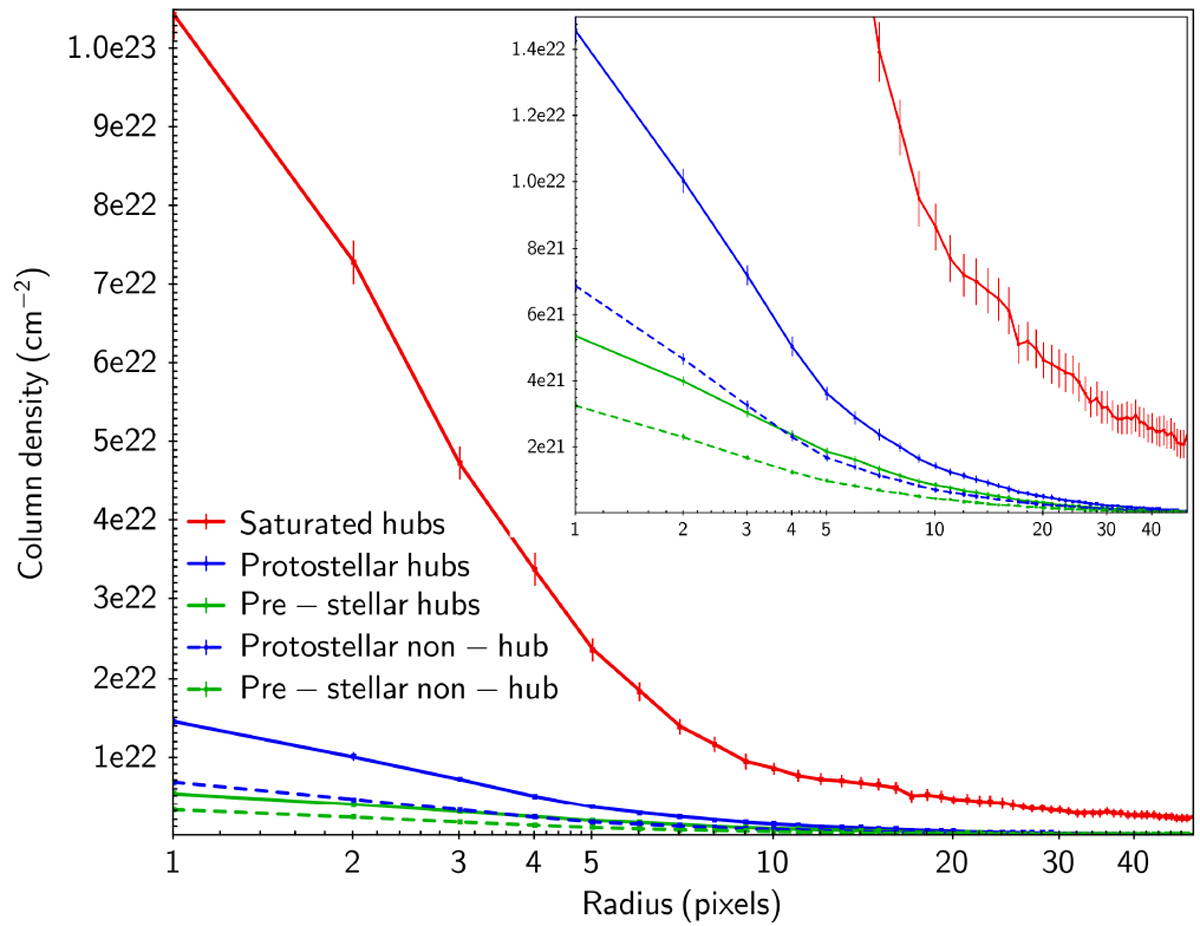
Circularly averaged radial column density profiles centred on the studied clumps. The column density is plotted as a function of pixel (each pixel is an azimuthal average) distance from the centre. The error bars display the standard deviation onthe azimuthal average at each pixel. Saturated proto-stellar clumps are plotted separately because the fluxes are modelled and recovered from Gaussian fitting.
Current usage metrics show cumulative count of Article Views (full-text article views including HTML views, PDF and ePub downloads, according to the available data) and Abstracts Views on Vision4Press platform.
Data correspond to usage on the plateform after 2015. The current usage metrics is available 48-96 hours after online publication and is updated daily on week days.
Initial download of the metrics may take a while.