Fig. B.1.
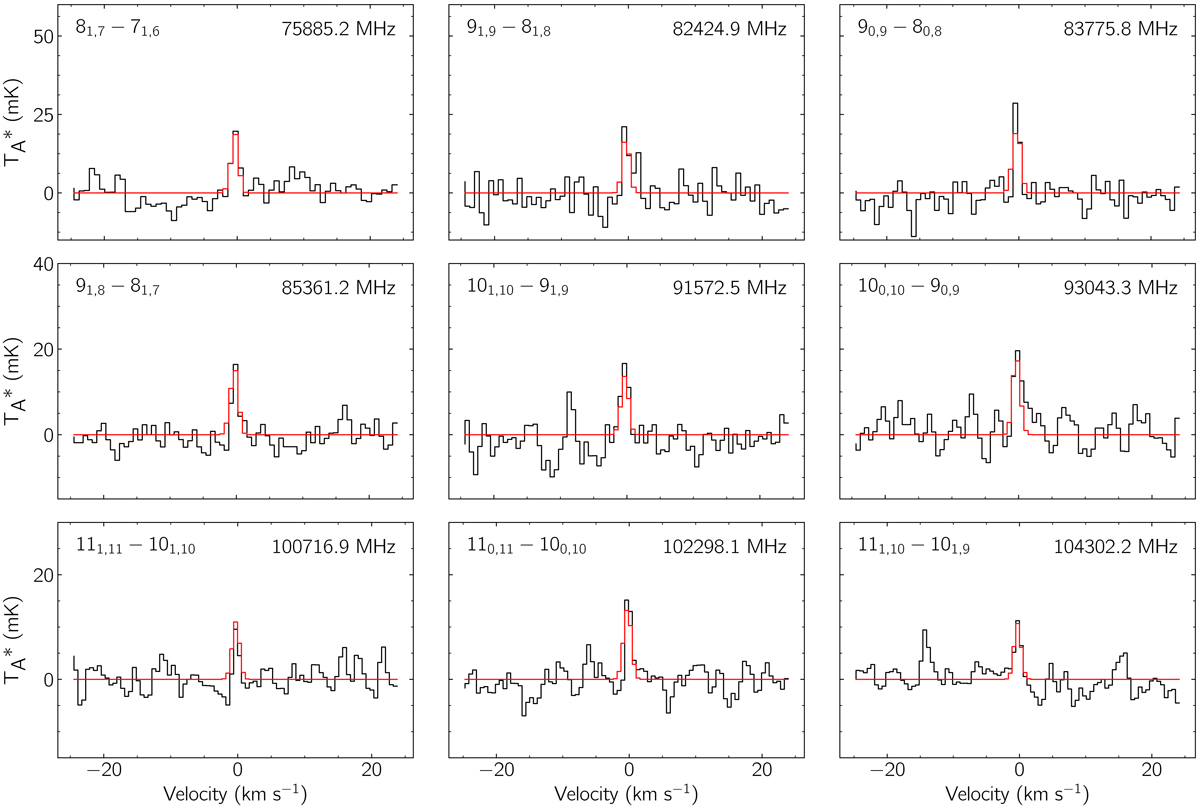
Transitions of propynal identified in the ASAI data toward L1527 with an S/N ratio of ≥3. Transition parameters are given in Table B.2. The observational data are shown in black. A simulation of propynal using the derived best fit column density and temperature is shown in red using a noise-weighted average linewidth derived from our Gaussian fits to the individual lines (1.2 km s−1) and simulated at the same resolution and frequency sampling as the observations.
Current usage metrics show cumulative count of Article Views (full-text article views including HTML views, PDF and ePub downloads, according to the available data) and Abstracts Views on Vision4Press platform.
Data correspond to usage on the plateform after 2015. The current usage metrics is available 48-96 hours after online publication and is updated daily on week days.
Initial download of the metrics may take a while.