Fig. 4.
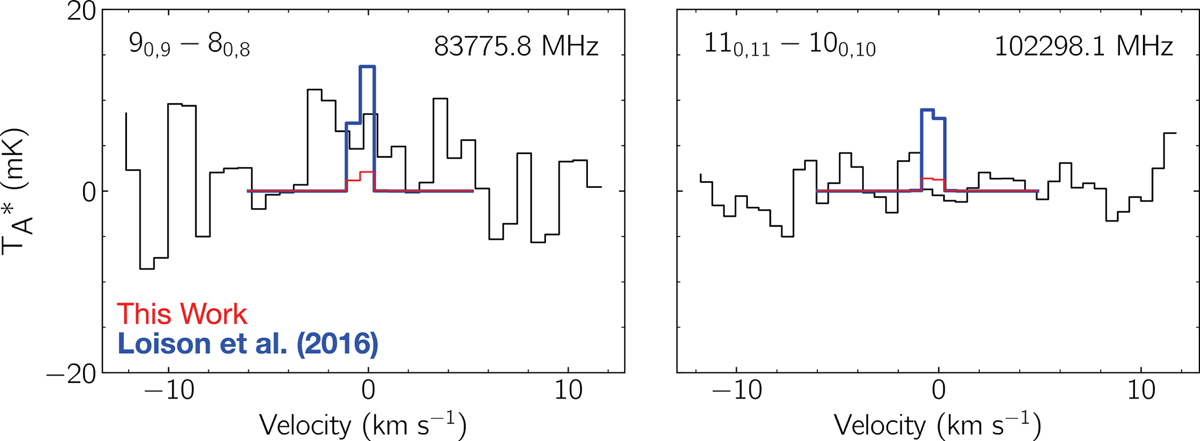
Simulations of propynal emission in the 90, 9 − 80, 8 and 110, 11 − 100, 10 transitions overlaid on the ASAI observations of Barnard 1. The bold, blue trace represents the expected emission profile given the column density and linewidth reported in Loison et al. (2016), although using our partition function. The thinner red trace is the upper limit presented from our work, simulated using the linewidth from Loison et al. (2016).
Current usage metrics show cumulative count of Article Views (full-text article views including HTML views, PDF and ePub downloads, according to the available data) and Abstracts Views on Vision4Press platform.
Data correspond to usage on the plateform after 2015. The current usage metrics is available 48-96 hours after online publication and is updated daily on week days.
Initial download of the metrics may take a while.