Open Access
Fig. 3.
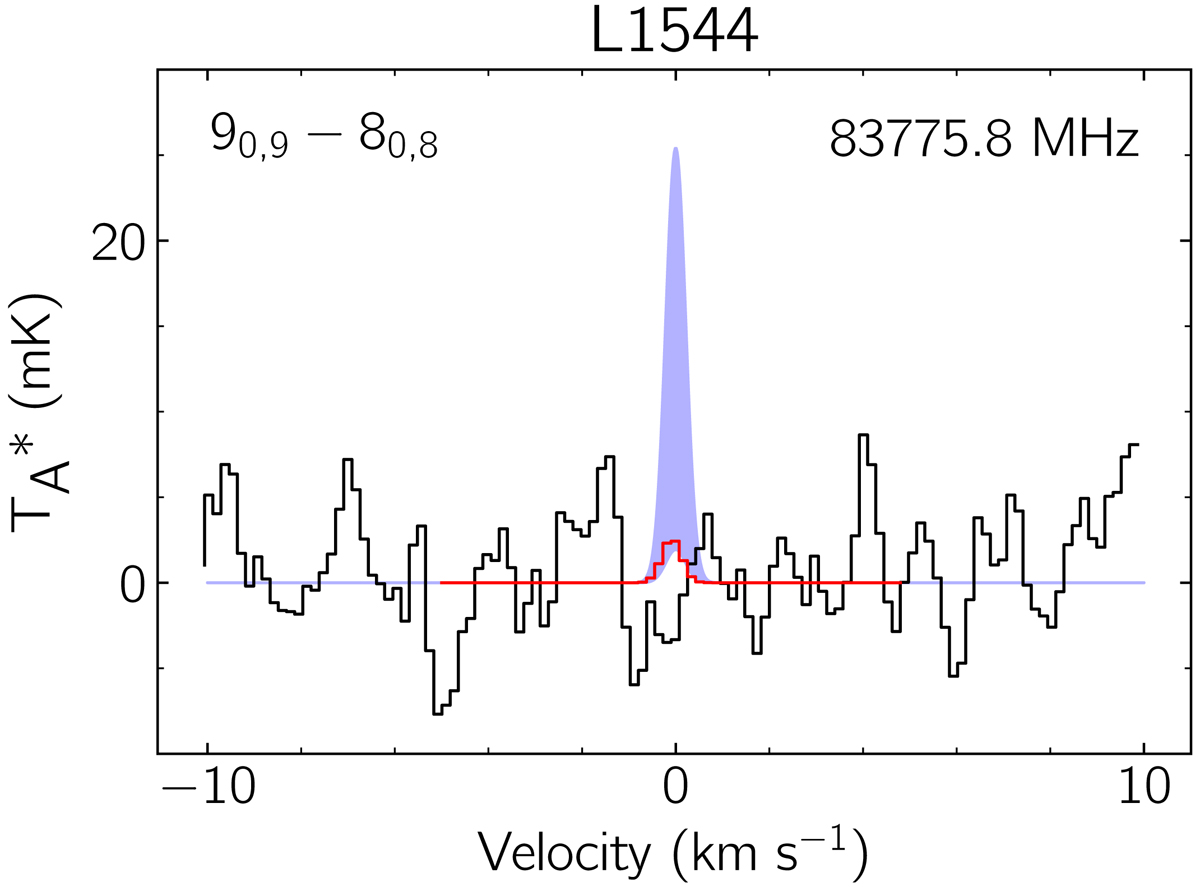
Simulation of the 90, 9 − 80, 8 transition of propynal toward L1544 using our derived upper-limit parameters in red over the ASAI observations in black. The shaded blue curve represents the range of potential line profiles for this transition based on the values reported in Jimenez-Serra et al. (2016).
Current usage metrics show cumulative count of Article Views (full-text article views including HTML views, PDF and ePub downloads, according to the available data) and Abstracts Views on Vision4Press platform.
Data correspond to usage on the plateform after 2015. The current usage metrics is available 48-96 hours after online publication and is updated daily on week days.
Initial download of the metrics may take a while.