Fig. 2.
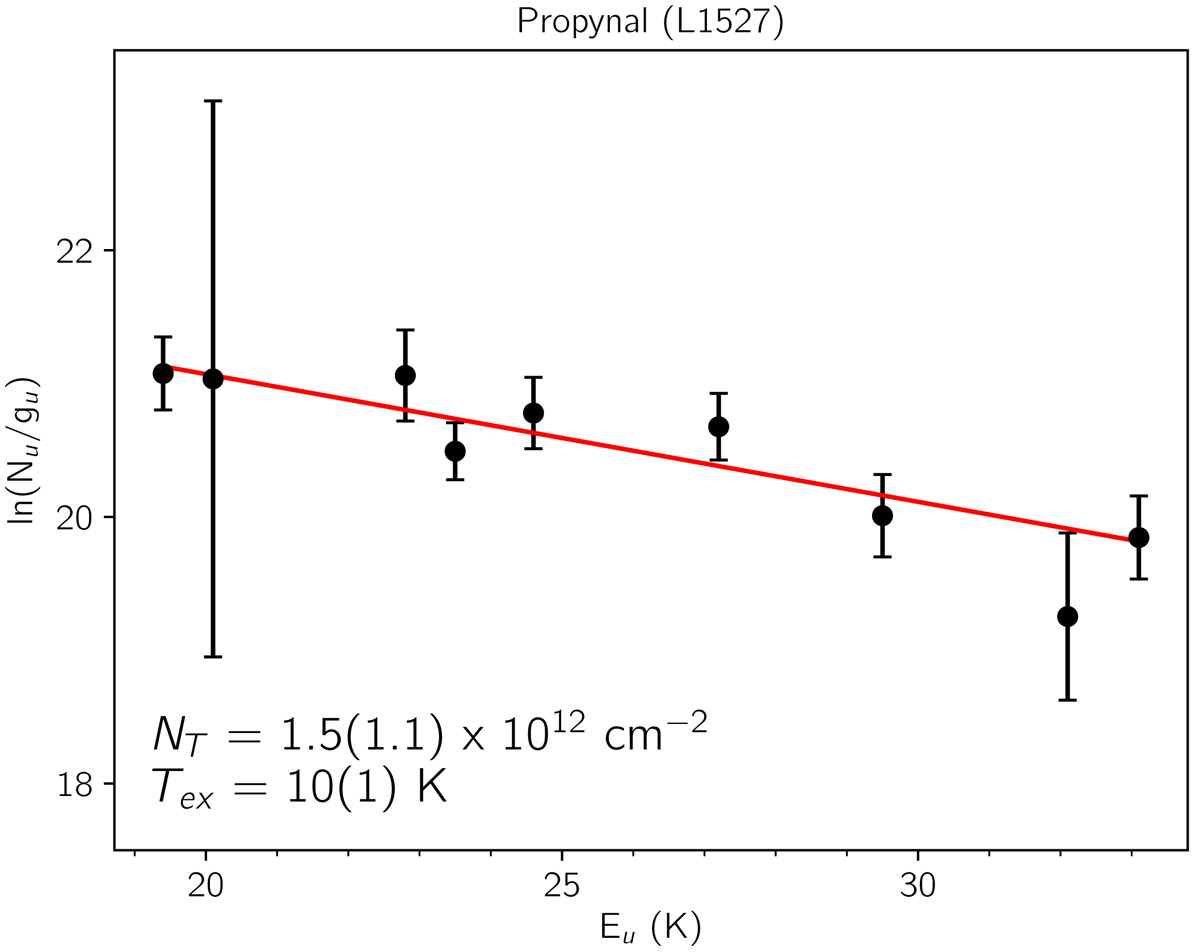
Rotation diagram of propynal detection in L1527, using the lines and parameters reported in Table B.2. The reported errors in column density and temperature are the 1σ statistical errors from the least squares fit to the data, while the error bars for the data points are derived from the 1σ statistical errors in intensity and velocity width from the Gaussian fits to the lines.
Current usage metrics show cumulative count of Article Views (full-text article views including HTML views, PDF and ePub downloads, according to the available data) and Abstracts Views on Vision4Press platform.
Data correspond to usage on the plateform after 2015. The current usage metrics is available 48-96 hours after online publication and is updated daily on week days.
Initial download of the metrics may take a while.