Fig. 5
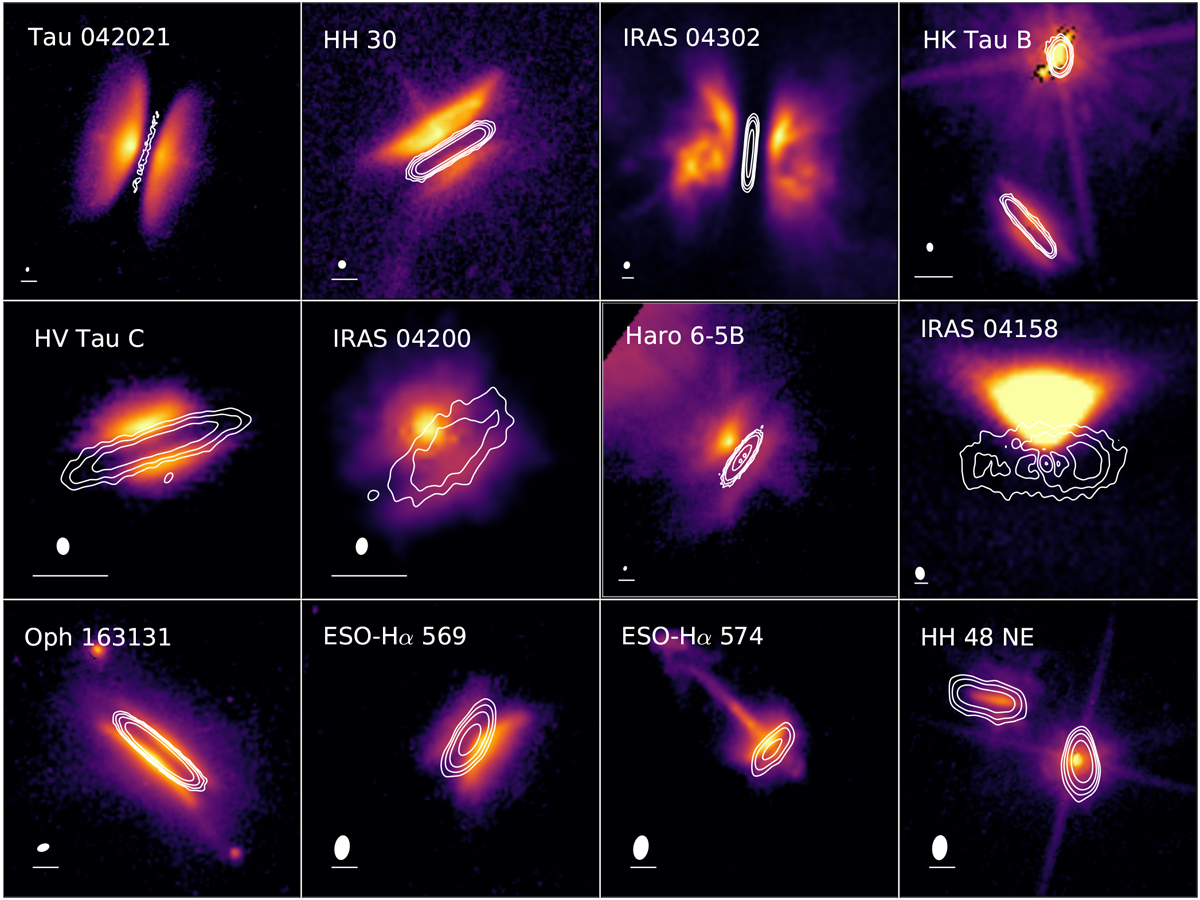
Overlay of scattered light (colors, in logarithmic scales) and ALMA band 7 continuum images (5, 10, 20, and 50σ contours) for all sources in this study, except for Oph 163131 for which we show the band 6 image. The scattered light images are plotted between 3σ (except for IRAS 04302 and IRAS 04158, where we use respectively 60 and 1σ to increase the contrast) and their maximum brightness (except for IRAS 04158, for which we take a lower value to increase the contrast). The ellipse and horizontal line in the bottom left corner indicate the beam size of the ALMA image and a 0.5′′ scale. References. Scattered light images, 2.2 μm: HV Tau C: Duchêne et al. (2010); 1.9 μm: IRAS 04302: Padgett et al. (1999); 1.6 μm: Haro 6-5B: Padgett et al. (1999); 0.8 μm: Tau 042021: Duchêne et al. (2014), HH 30: Watson & Stapelfeldt (2004), IRAS 04158: Glauser et al. (2008), ESO-Hα 569: Wolff et al. (2017), HH 48 NE: Stapelfeldt et al. (2014); 0.6 μm: IRAS 04200: Stapelfeldt et al. (in prep.), Oph 163131: Stapelfeldt et al. (2014), ESO-Hα 574: Stapelfeldt et al. (2014); 0.4 μm: HK Tau B: Duchêne et al. (in prep.).
Current usage metrics show cumulative count of Article Views (full-text article views including HTML views, PDF and ePub downloads, according to the available data) and Abstracts Views on Vision4Press platform.
Data correspond to usage on the plateform after 2015. The current usage metrics is available 48-96 hours after online publication and is updated daily on week days.
Initial download of the metrics may take a while.