Fig. 4
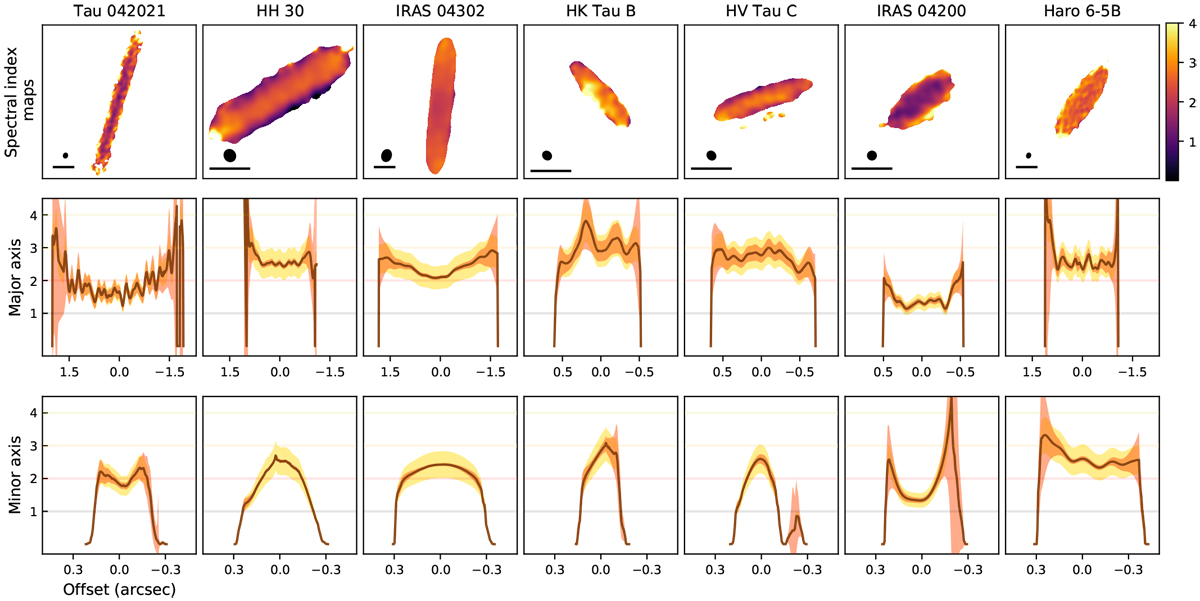
Top row: spectral index maps, applying a filter to keep only the pixels with more emission than 5σ in both bands. The beam size is shown in the bottom left corner, along with a dark line representing a 0.5′′ scale. Middle row: spectral index cuts along the major axis. Bottom row: spectral index profiles along the minor axis, averaged as done for Fig. 3 (see text Sect. 3.2.2). For all cuts, yellow errors correspond to a flux calibration error of 10% in both bands, while orange errors are estimated from the signal-to-noise in each band. The x-axis corresponds to the offset to the center of the disk in arcseconds.
Current usage metrics show cumulative count of Article Views (full-text article views including HTML views, PDF and ePub downloads, according to the available data) and Abstracts Views on Vision4Press platform.
Data correspond to usage on the plateform after 2015. The current usage metrics is available 48-96 hours after online publication and is updated daily on week days.
Initial download of the metrics may take a while.