Fig. 3
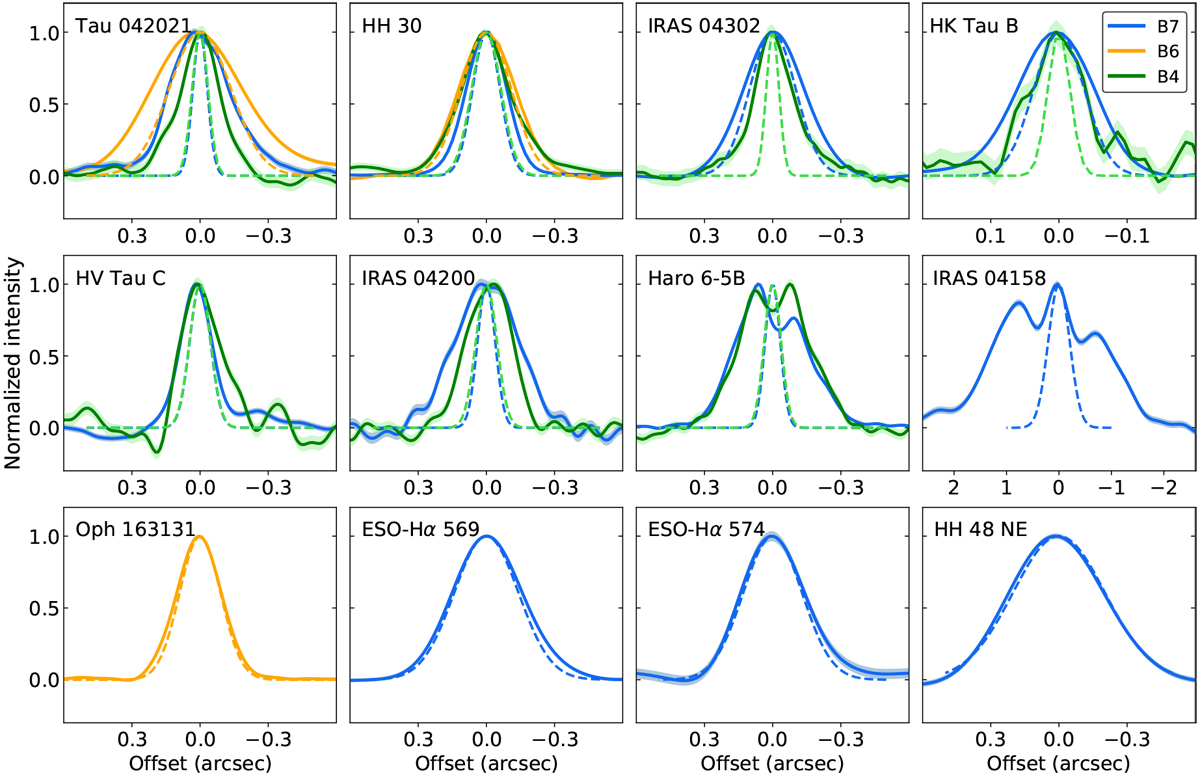
Normalized averaged minor axis intensity profiles. For the most inclined sources (resp. least inclined: IRAS 04200, Haro 6-5B, and IRAS 04158), these were obtained by averaging minor axis intensity cuts over the whole major axis extent of the disk (resp. over the central 0.3′′). The light shading corresponds to the normalized rms in each band. The beam sizes in the direction of the minor axis are shown as dotted Gaussian of the corresponding color.
Current usage metrics show cumulative count of Article Views (full-text article views including HTML views, PDF and ePub downloads, according to the available data) and Abstracts Views on Vision4Press platform.
Data correspond to usage on the plateform after 2015. The current usage metrics is available 48-96 hours after online publication and is updated daily on week days.
Initial download of the metrics may take a while.