Fig. 2
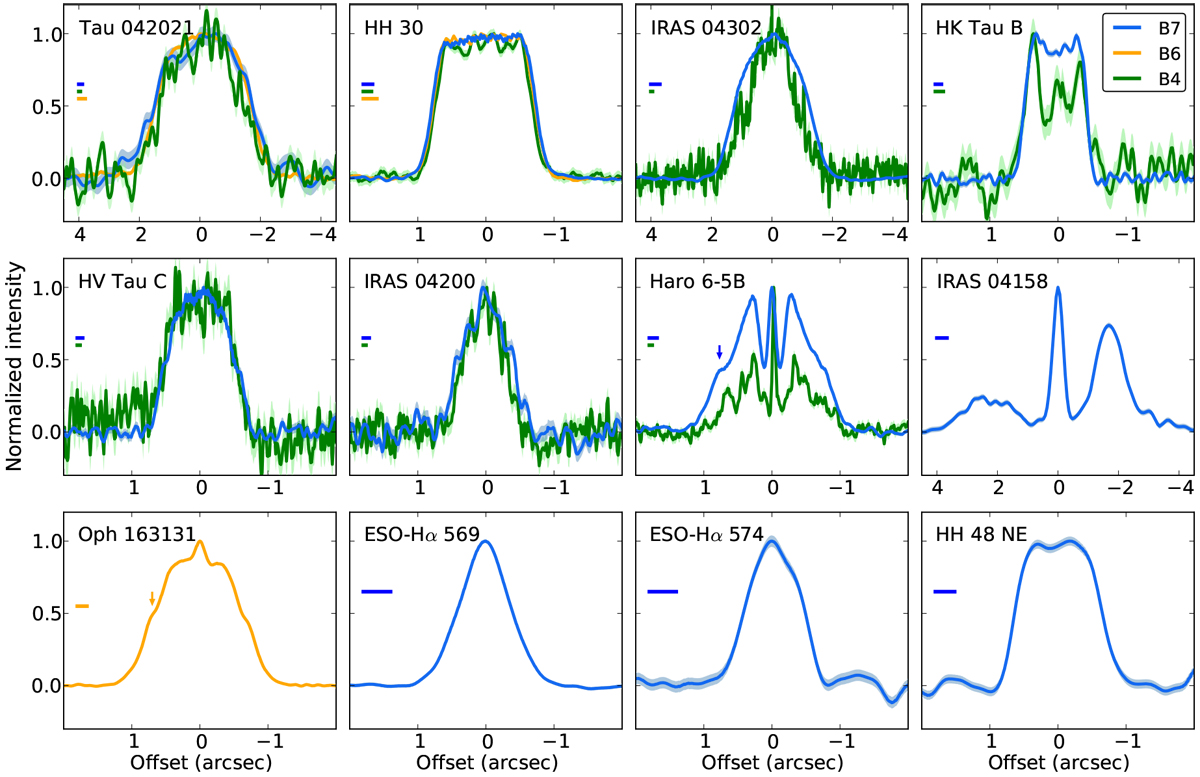
Normalized major axis intensity profiles. Data in the three bands are represented by the green (band 4), orange (band 6) and blue (band 7) lines. The light shading corresponds to the normalized rms in each band. The beam sizes in the direction of the cut are shown in the left part of each plot as horizontal lines. We indicate the shoulders of Haro 6-5B and Oph 163131 by an arrow. We smoothed the cuts through Tau 042021 by convolving them by a 1-D Gaussian of the beam width, to reduce the noise and make the plot clearer.
Current usage metrics show cumulative count of Article Views (full-text article views including HTML views, PDF and ePub downloads, according to the available data) and Abstracts Views on Vision4Press platform.
Data correspond to usage on the plateform after 2015. The current usage metrics is available 48-96 hours after online publication and is updated daily on week days.
Initial download of the metrics may take a while.