Fig. B.1
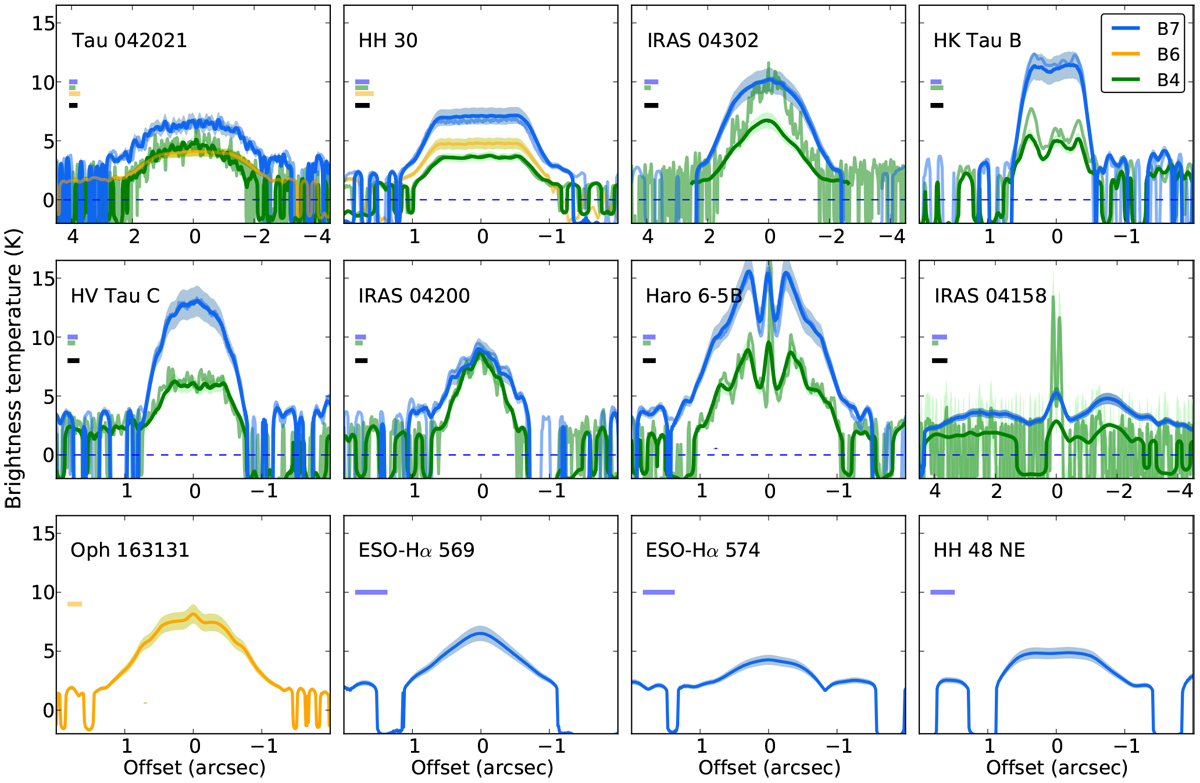
Observed brightness temperatures as a function of the radial distance to the central star. Solid lines profiles (band 7 and band 4 only) were computed with the same angular resolution (restored beam in Table A.1), while the light lines have the original angular resolution. We report the beam sizes in the direction of the cut as horizontal lines in the left part of each plot. The restored beam corresponds to the black line. Error bars correspond to 10% of the brightness temperature.
Current usage metrics show cumulative count of Article Views (full-text article views including HTML views, PDF and ePub downloads, according to the available data) and Abstracts Views on Vision4Press platform.
Data correspond to usage on the plateform after 2015. The current usage metrics is available 48-96 hours after online publication and is updated daily on week days.
Initial download of the metrics may take a while.