Fig. 10
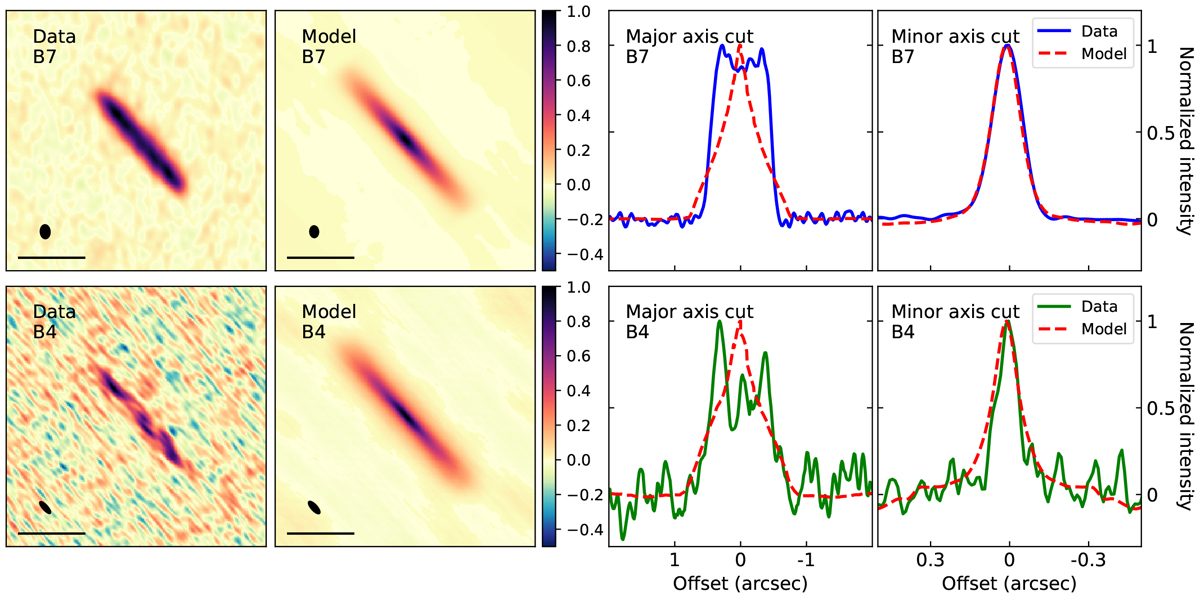
Left panels: ALMA data of HK Tau B. In all the figure, top row is band 7 and bottom row is band 4. Middle-left panels: millimeter images of the best model C of Stapelfeldt et al. (1998), assuming well mixed grains. They were computed for the same uv-coverage as in the data. Middle-right panels: major axis cuts of the model and the data. Right panels: averaged minor axis cuts of the data and the models, performed as in Sect. 3.2.2.
Current usage metrics show cumulative count of Article Views (full-text article views including HTML views, PDF and ePub downloads, according to the available data) and Abstracts Views on Vision4Press platform.
Data correspond to usage on the plateform after 2015. The current usage metrics is available 48-96 hours after online publication and is updated daily on week days.
Initial download of the metrics may take a while.