Fig. 6.
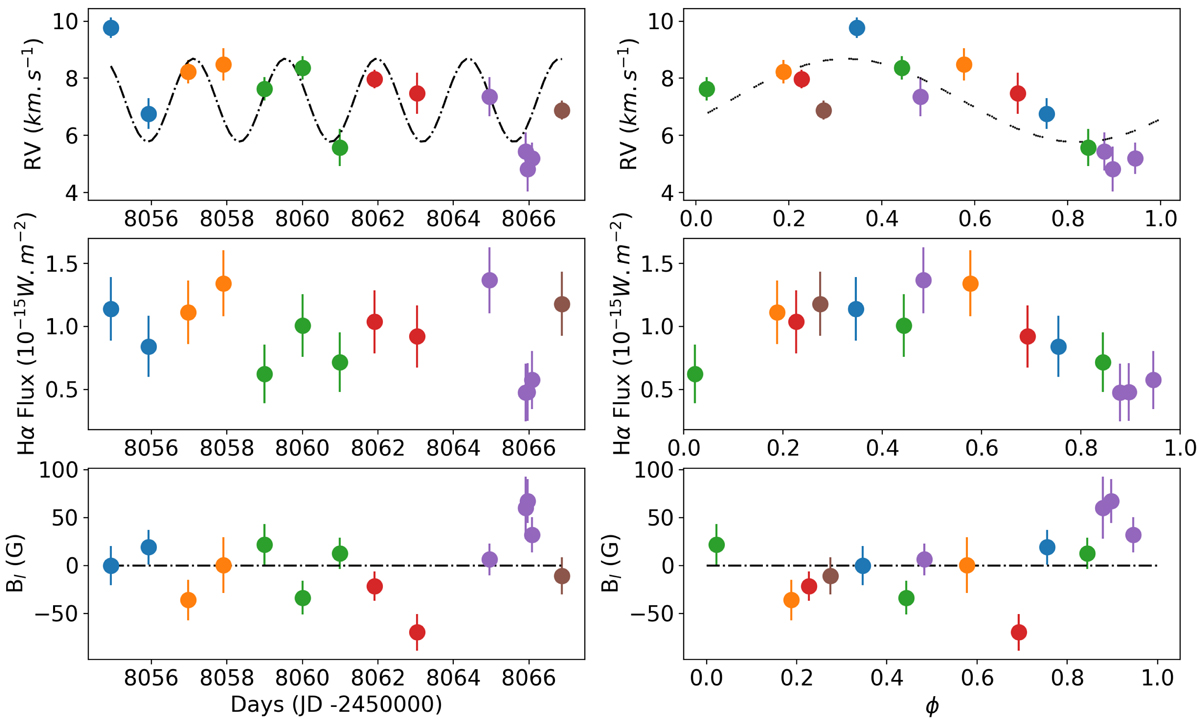
From top to bottom: radial velocity, Hα line flux, and average longitudinal magnetic field as a function of Julian date (left) and rotational phase (right). The sinusoidal fit, forced at the K2 photometric period, to radial velocity variations is shown as a black dash-dotted curve in the top panels. The Bl = 0 G line is drawn for reference in the bottom panels.
Current usage metrics show cumulative count of Article Views (full-text article views including HTML views, PDF and ePub downloads, according to the available data) and Abstracts Views on Vision4Press platform.
Data correspond to usage on the plateform after 2015. The current usage metrics is available 48-96 hours after online publication and is updated daily on week days.
Initial download of the metrics may take a while.