Fig. 3.
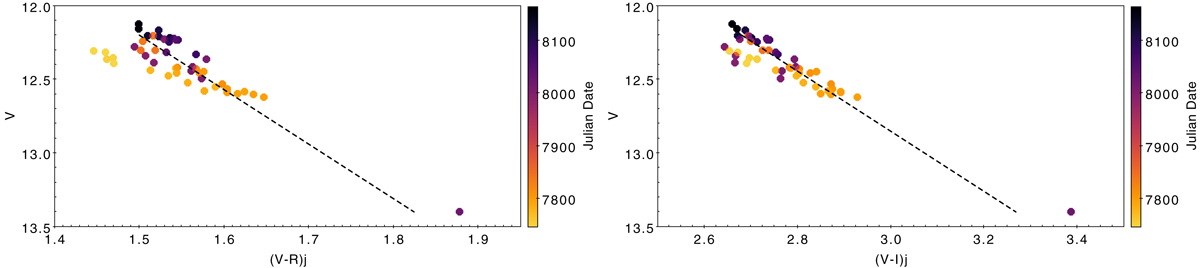
Color-magnitude plots from CrAO VRJIJ photometry. Left: (V − R)J vs. V. Right: (V − I)J vs. V. The source gets redder when fainter. The dashed line is the expected reddening line for ISM extinction. The photometric measurements are color-coded by Julian date to distinguish the 2 observing seasons: lighter points correspond to the first epoch, darker points to the second one (see Fig. 2). We note that the deep faintening event of about 1.2 mag in the V-band is accompanied by a strong reddening of the system.
Current usage metrics show cumulative count of Article Views (full-text article views including HTML views, PDF and ePub downloads, according to the available data) and Abstracts Views on Vision4Press platform.
Data correspond to usage on the plateform after 2015. The current usage metrics is available 48-96 hours after online publication and is updated daily on week days.
Initial download of the metrics may take a while.