Fig. 2.
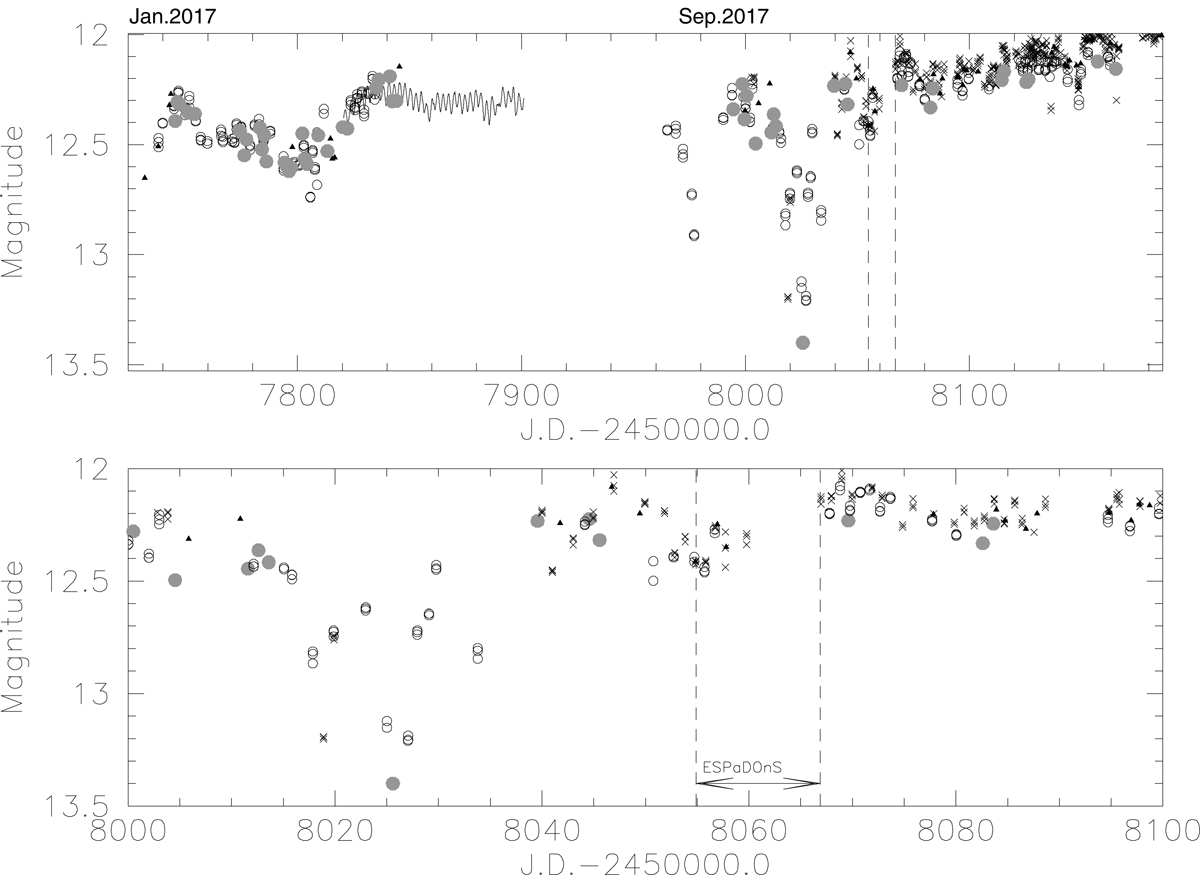
HQ Tau’s V-band light curve. CrAO measurements are shown as filled grey circles, the K2 light curve as a continuous line, AAVSO measurements as filled triangles, and the ASAS-SN rescaled g- and V-band datasets as crosses and open circles, respectively. The upper panel shows the light curve over 2 observing seasons while the lower one displays the photometric variability of the source around the CFHT/ESPaDOnS observations.
Current usage metrics show cumulative count of Article Views (full-text article views including HTML views, PDF and ePub downloads, according to the available data) and Abstracts Views on Vision4Press platform.
Data correspond to usage on the plateform after 2015. The current usage metrics is available 48-96 hours after online publication and is updated daily on week days.
Initial download of the metrics may take a while.