Fig. 8.
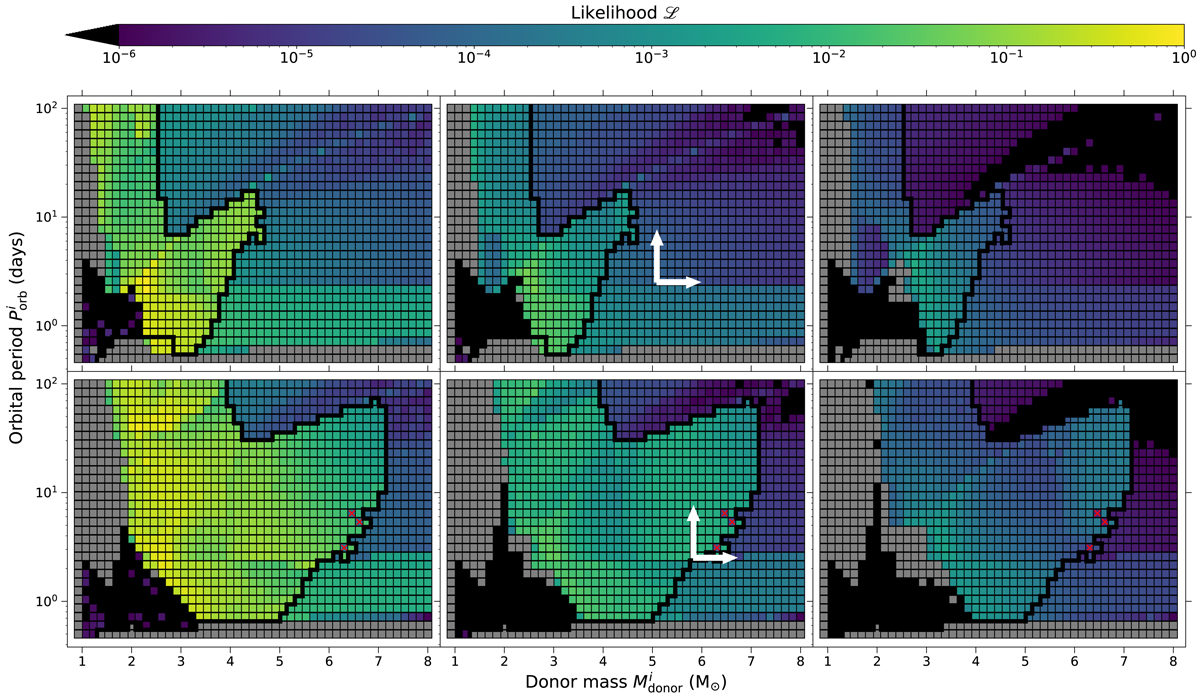
Top row: relative likelihood (ℒ) to observe a system as a ULX, as described by Eq. (20), for LMXBs/IMXBs with a 1.3 M⊙ NS. The panels are arranged as in Fig. 7. Going from the leftmost to the rightmost panel (> 10 to > 1000 LEdd), ℒ is higher for stable binaries with lower luminosities as their emission is not as strongly beamed. There is in addition some effect by the transition from case A to case B RLO. All values below 10−6 are shown in black as they correspond to insignificant likelihood. Bottom row: same as the top row but for LMXBs/IMXBs with a 2.0 M⊙ NS.
Current usage metrics show cumulative count of Article Views (full-text article views including HTML views, PDF and ePub downloads, according to the available data) and Abstracts Views on Vision4Press platform.
Data correspond to usage on the plateform after 2015. The current usage metrics is available 48-96 hours after online publication and is updated daily on week days.
Initial download of the metrics may take a while.