Fig. 4.
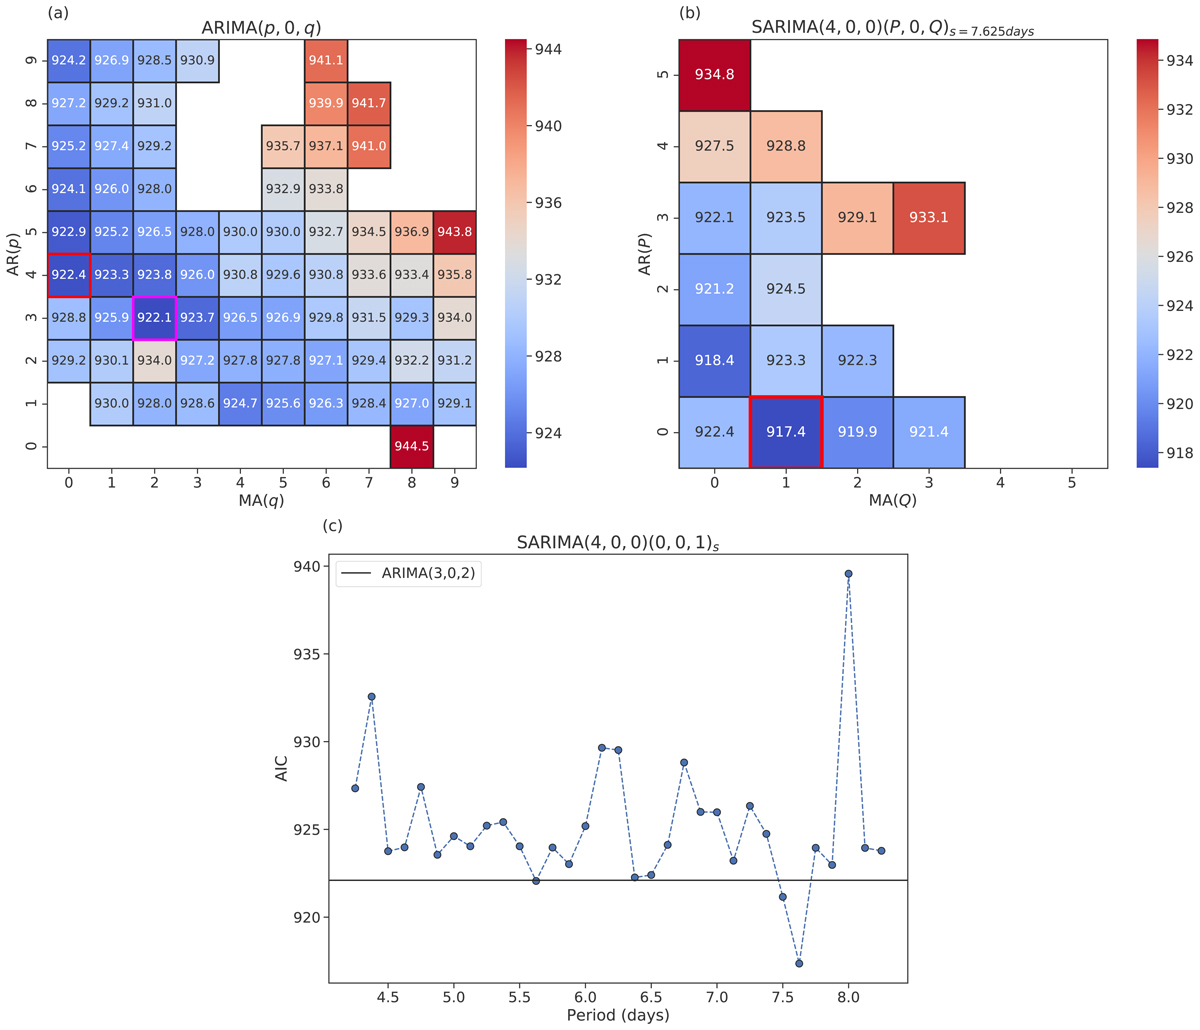
AIC map for the SARIMA modeling of the light curve. (a) AIC map for ARIMA(p, d, q) models. Though the minimum occurs at ARIMA(3, 0, 2) (the box marked with magenta square), the global minimum, while considering SARIMA comes at SARIMA(4, 0, 0)×(0, 0, 1) (the box marked with red square). (b) AIC map for SARIMA(4, 0, 0)×(P, 0, Q). We observe the global minimum at SARIMA(4, 0, 0)×(0, 0, 1) considering a period (season of 7.625 days). The AIC values are provided in the boxes. In the uncolored region, either the fit did not converge or the AIC is greater than a set threshold. This is done to improve color resolution. (c) AIC values for different periods. We see a global minimum at 7.625 days.
Current usage metrics show cumulative count of Article Views (full-text article views including HTML views, PDF and ePub downloads, according to the available data) and Abstracts Views on Vision4Press platform.
Data correspond to usage on the plateform after 2015. The current usage metrics is available 48-96 hours after online publication and is updated daily on week days.
Initial download of the metrics may take a while.