Free Access
Fig. 2.
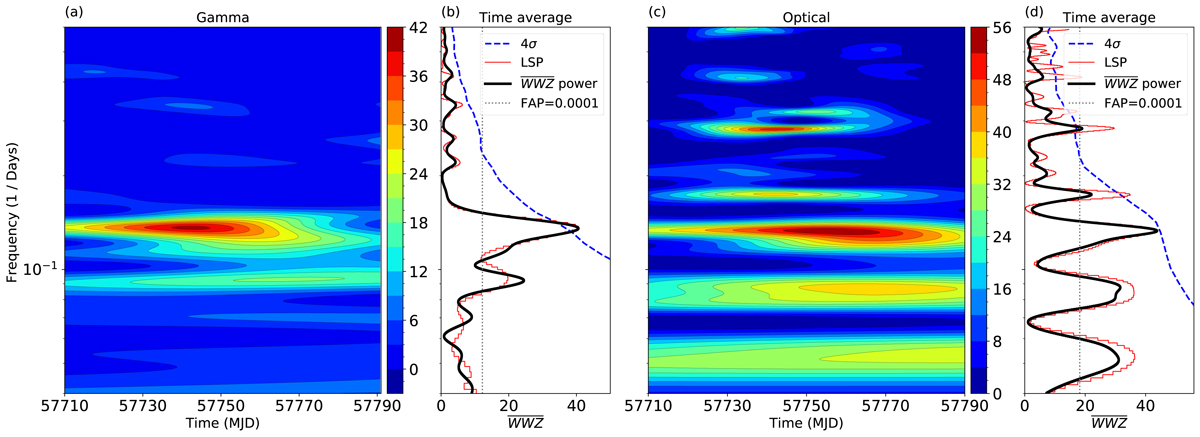
WWZ maps of CTA 102 during the 2016–17 flare. (a) γ-ray WWZ map showing strong periodicity of ∼7.6 days. (b) Time averaged γ-ray WWZ map (black) and the LSP (red). The dominant period (∼7.6 days) shows > 5σ significance. (c) Optical R-band WWZ map showing similar periodicity. (d) Same as (b) for R-band emissions.
Current usage metrics show cumulative count of Article Views (full-text article views including HTML views, PDF and ePub downloads, according to the available data) and Abstracts Views on Vision4Press platform.
Data correspond to usage on the plateform after 2015. The current usage metrics is available 48-96 hours after online publication and is updated daily on week days.
Initial download of the metrics may take a while.