Fig. 1.
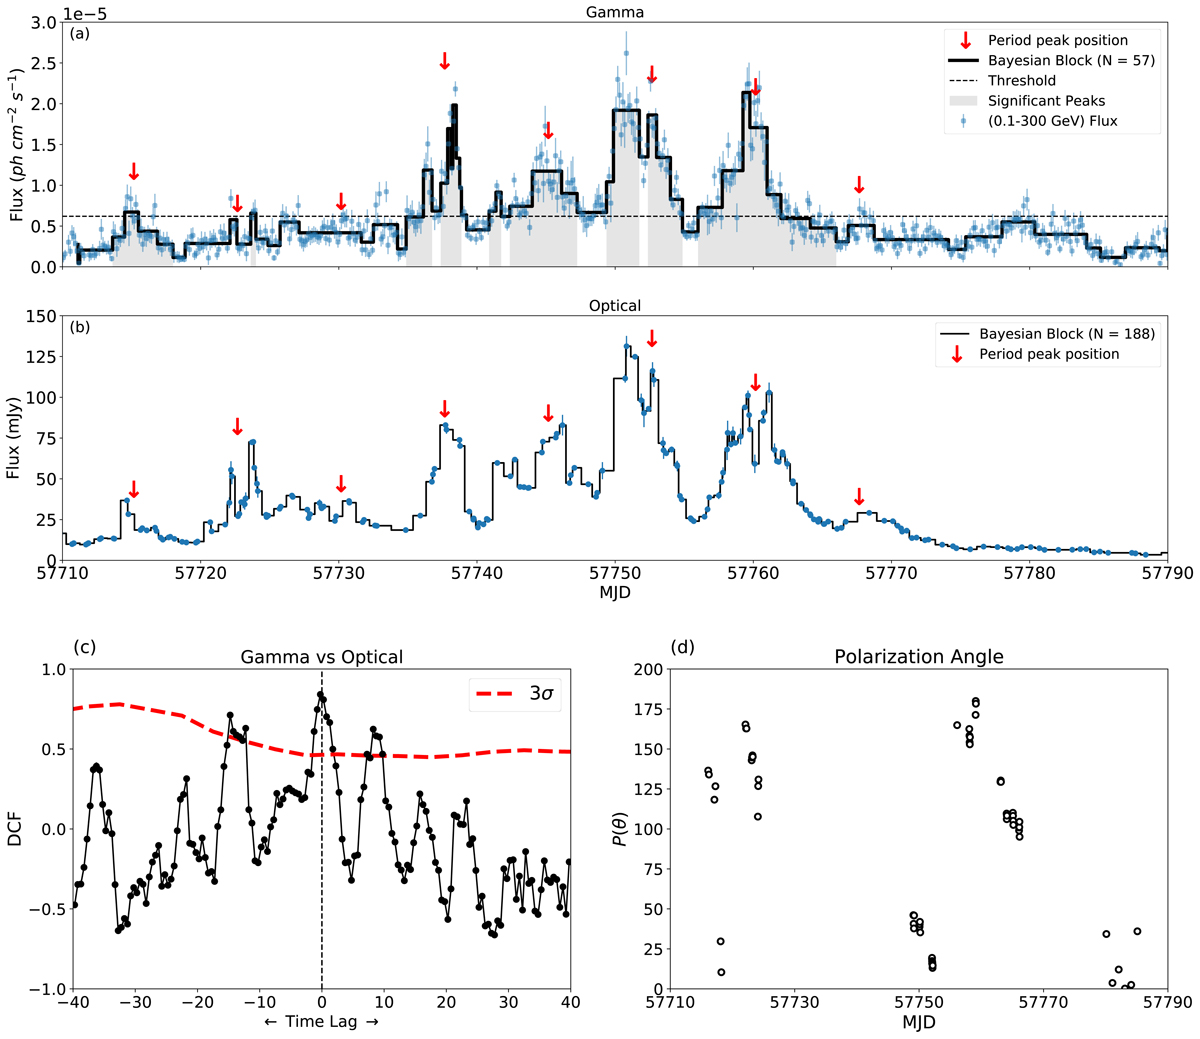
CTA 102 light curves during the 2016–17 flare. (a) Fermi-LAT (0.1−300 GeV) light curve. The black line gives the optimal block representation of the light curve. A peak is considered to be significant if the block height is greater than a set threshold. (b) Optical R band light curve and its optimal block representation. The QPO peaks are denoted by red arrows. (c) γ-ray and R-band emission DCF. (d) Optical polarization angle during the detected QPO.
Current usage metrics show cumulative count of Article Views (full-text article views including HTML views, PDF and ePub downloads, according to the available data) and Abstracts Views on Vision4Press platform.
Data correspond to usage on the plateform after 2015. The current usage metrics is available 48-96 hours after online publication and is updated daily on week days.
Initial download of the metrics may take a while.