Fig. 5.
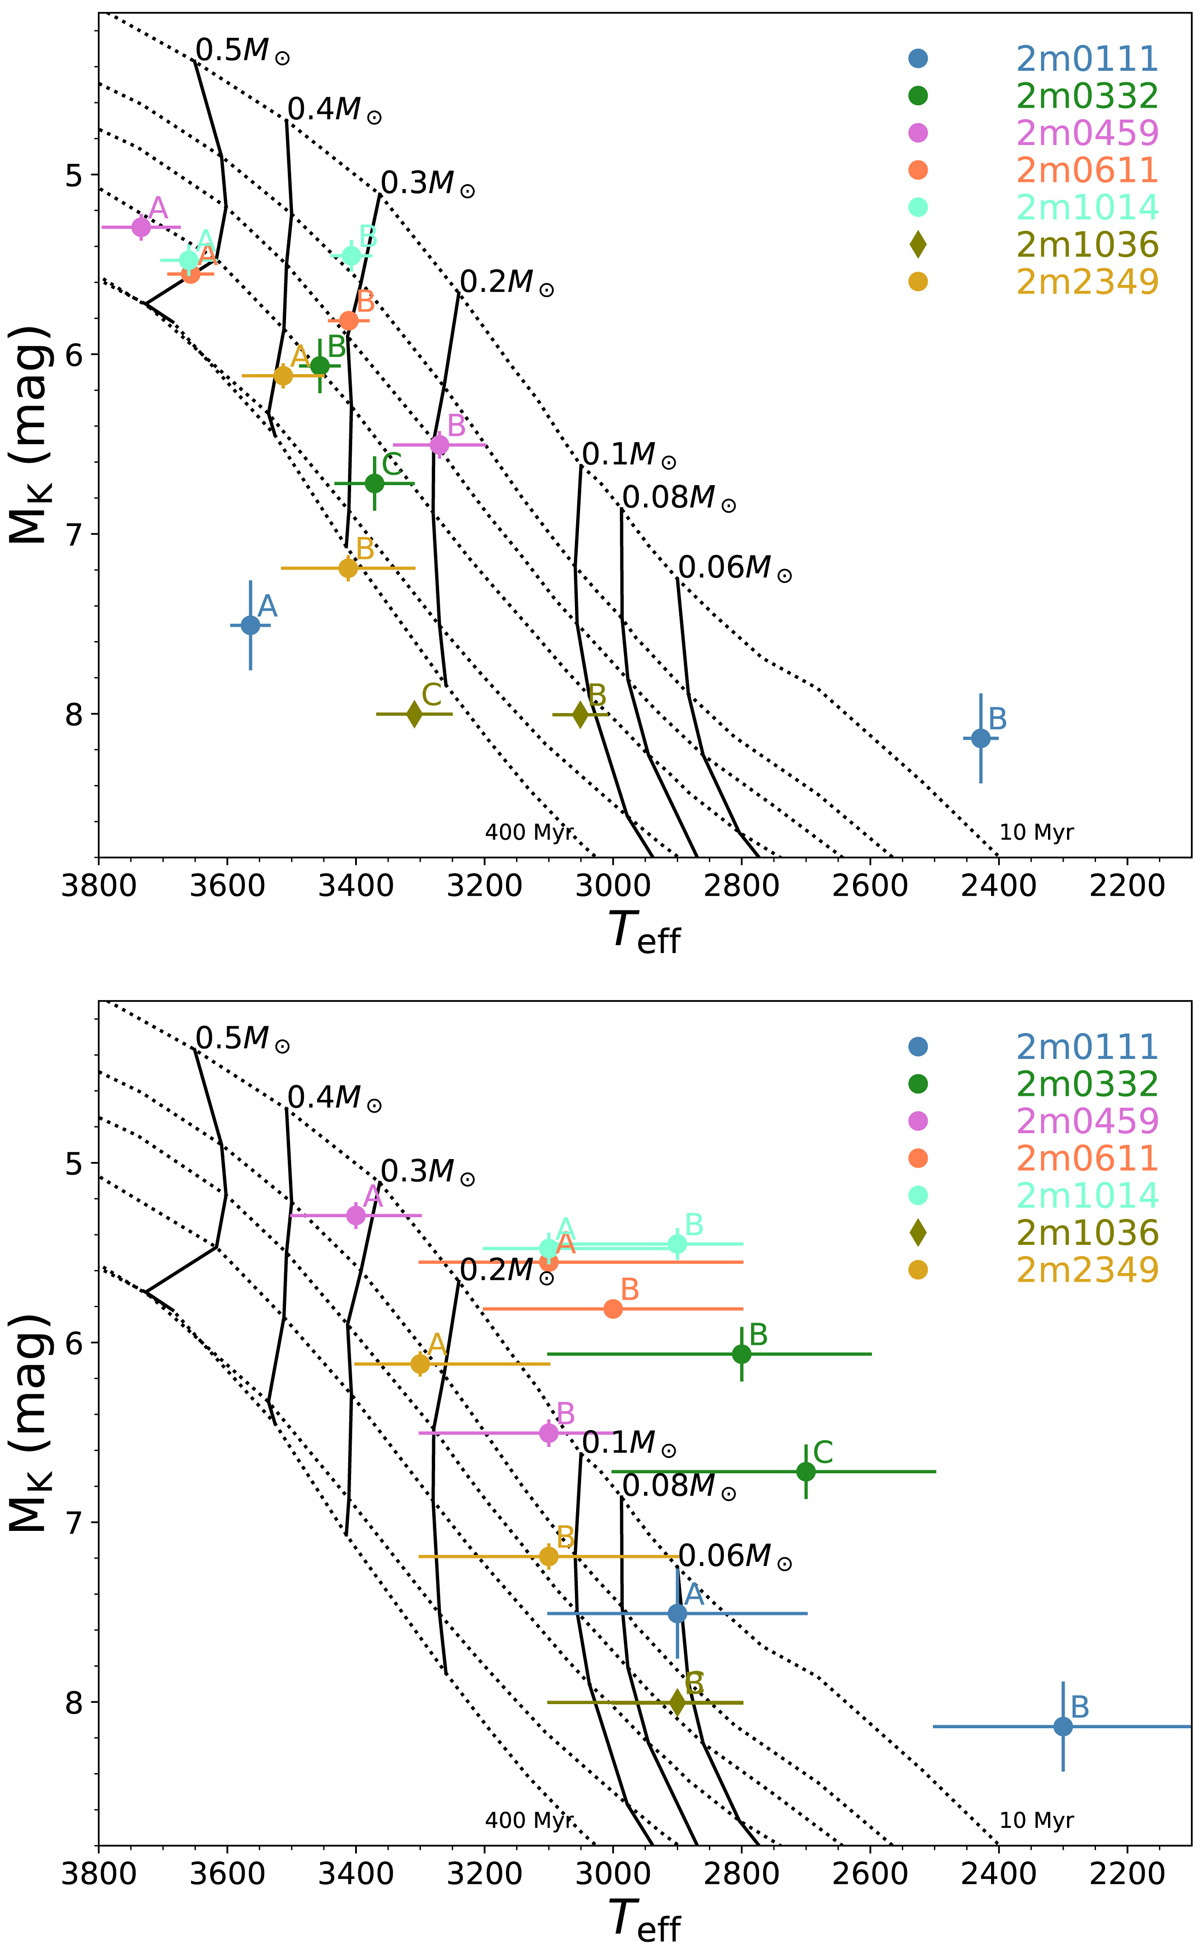
Isochrones from the BHAC (Baraffe et al. 2015) evolutionary models plotted as 2MASS K-band magnitudes as a function of effective temperature. The isochrones span ages 10, 20, 30, 50, 120, and 400 Myr (from top to bottom). Mass tracks at 0.06, 0.08, 0.1, 0.2, 0.3, 0.4, and 0.5 M⊙ are displayed going across the isochrones. The binary pairs are included in the figure as coloured circles where the absolute magnitude is calculated from the resolved K′-band magnitudes in Table 7 with either Gaia DR2 parallaxes or statistical distances from Malo et al. (2013). Top panel: effective temperatures (see Table 3) derived from the H2O–K2 indices; Bottom panel: effective temperature estimated from the K-band continuum fitted to theoretical models. Effective temperatures are listed in Table 3. The bottom panel indicates younger ages, and that the uncertainty for the effective temperature derived from the H2O–K2 index is underestimated. The J1036 system is depicted by diamonds in the plots, and is the only binary pair for which a dynamical mass estimate exists, estimated to be 0.24 ± 0.07 M⊙ for each individual component (Calissendorff et al. 2017).
Current usage metrics show cumulative count of Article Views (full-text article views including HTML views, PDF and ePub downloads, according to the available data) and Abstracts Views on Vision4Press platform.
Data correspond to usage on the plateform after 2015. The current usage metrics is available 48-96 hours after online publication and is updated daily on week days.
Initial download of the metrics may take a while.