Fig. 9
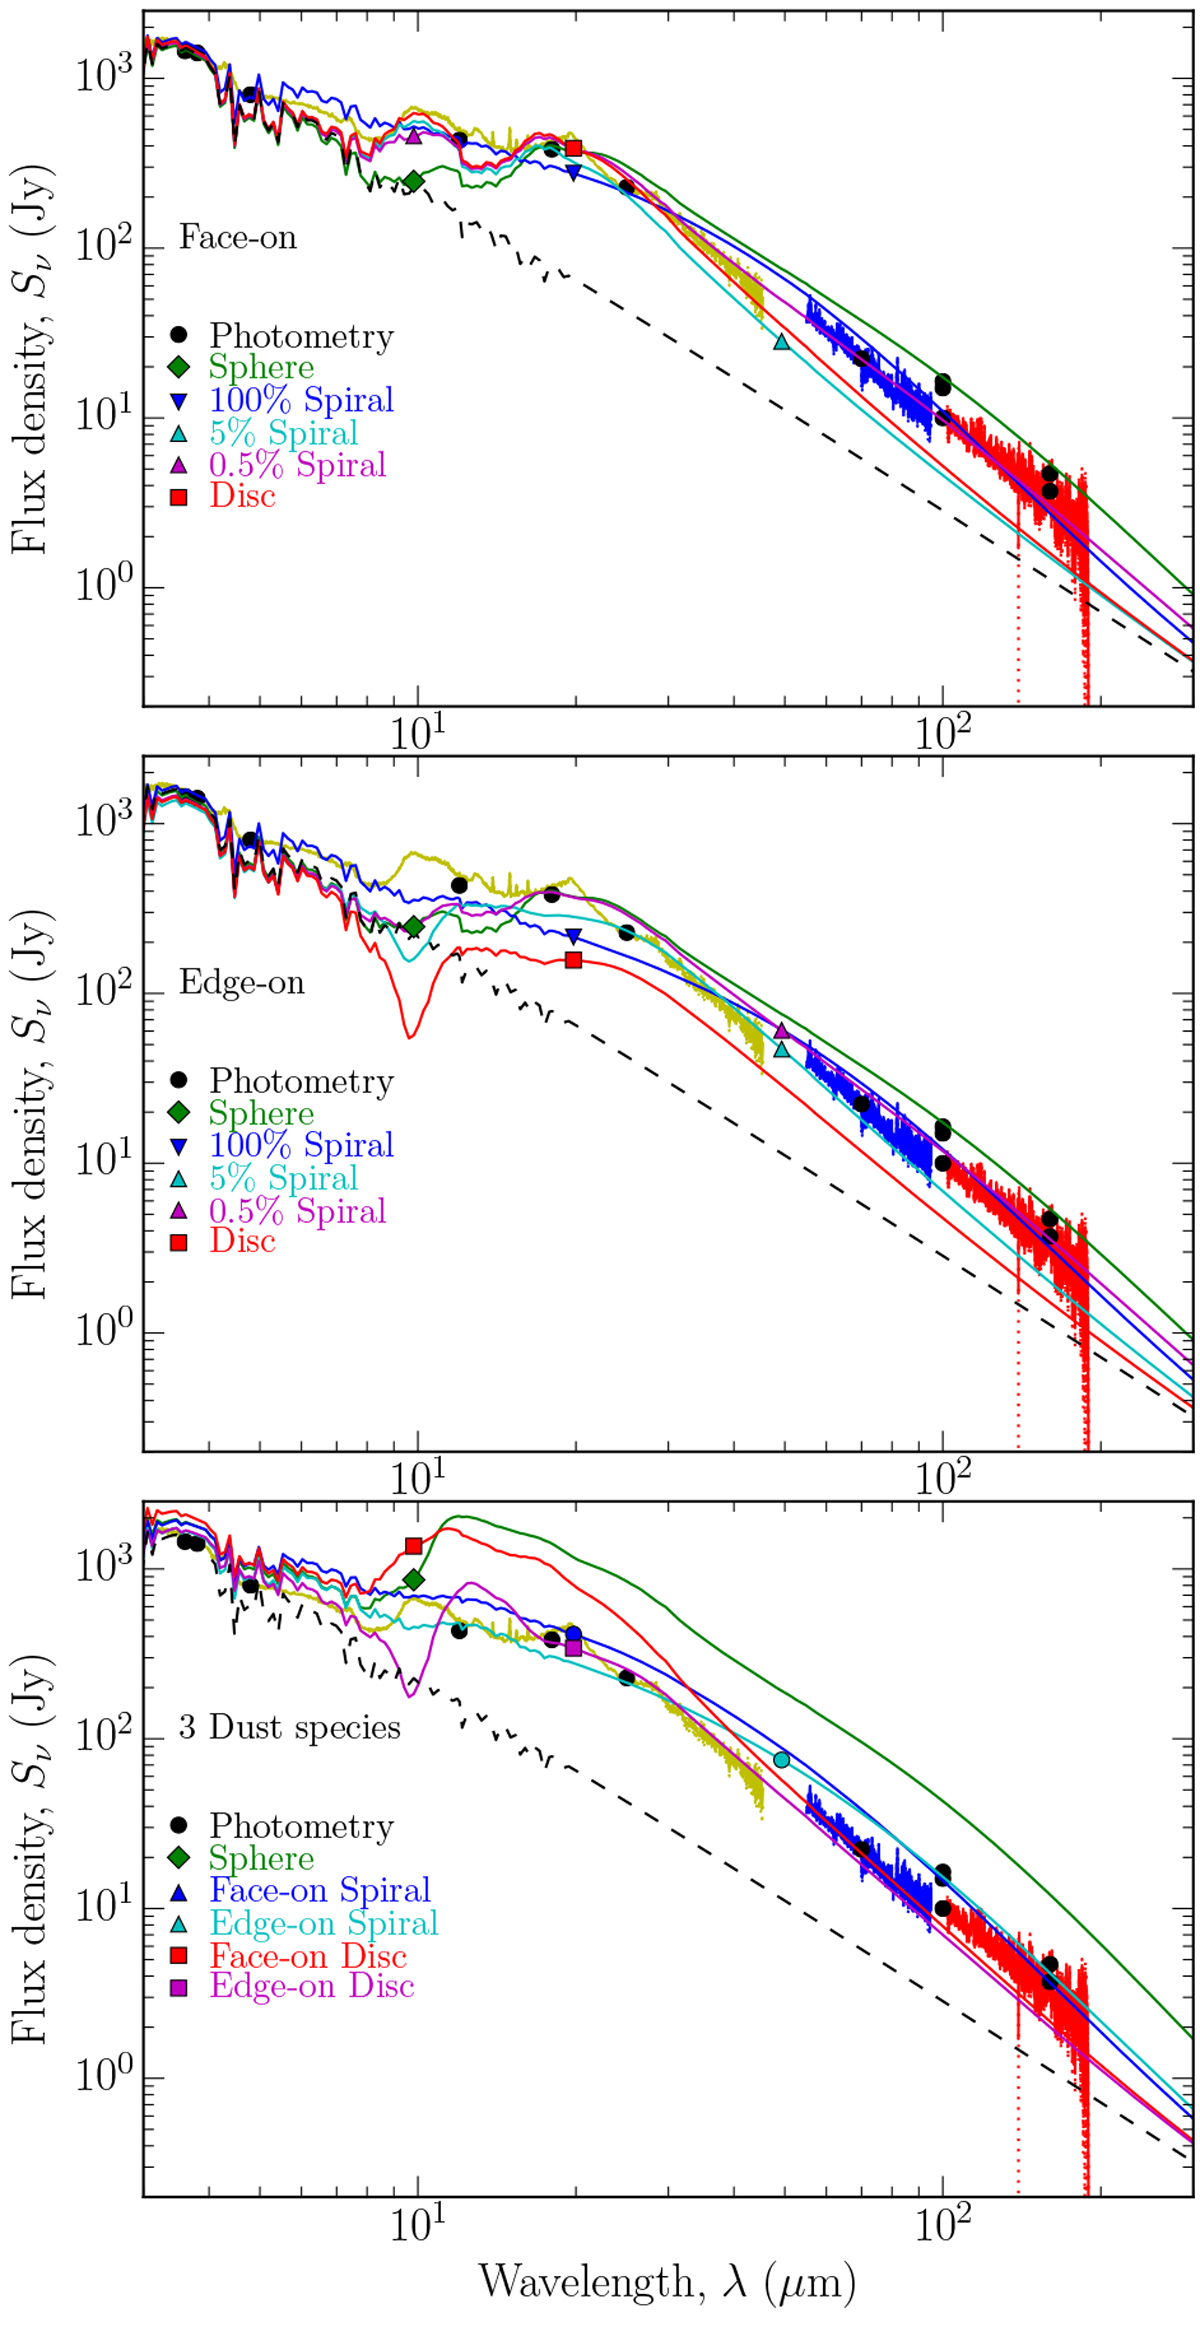
Comparison between best-fit models, photometry and IR spectra for EP Aqr. Top and mid panels: dust with 99% Mg2SiO4 and 1% Fe2SiO4. Top panel: SEDs from face-on geometry only. Mid panel: SEDs from edge-on geometry only. Bottom panel: compares the same dust masses and morphologies with these dust species; 90% Mg2SiO4, 9% Al2O3, and 1% Fe2SiO4. The different morphologies are indicated by different colours and symbols as annotated in the panels. The black dashed curve is the stellar photospheric SED model. The yellow spectrum is from ISO-SWS (Sloan et al. 2003). The blue and red spectra are from Herschel-PACS (Nicolaes et al. 2018). The photometry (Table 2) is shown as black dots (the error bars were smaller than the symbols and are not shown here).
Current usage metrics show cumulative count of Article Views (full-text article views including HTML views, PDF and ePub downloads, according to the available data) and Abstracts Views on Vision4Press platform.
Data correspond to usage on the plateform after 2015. The current usage metrics is available 48-96 hours after online publication and is updated daily on week days.
Initial download of the metrics may take a while.