Fig. 7
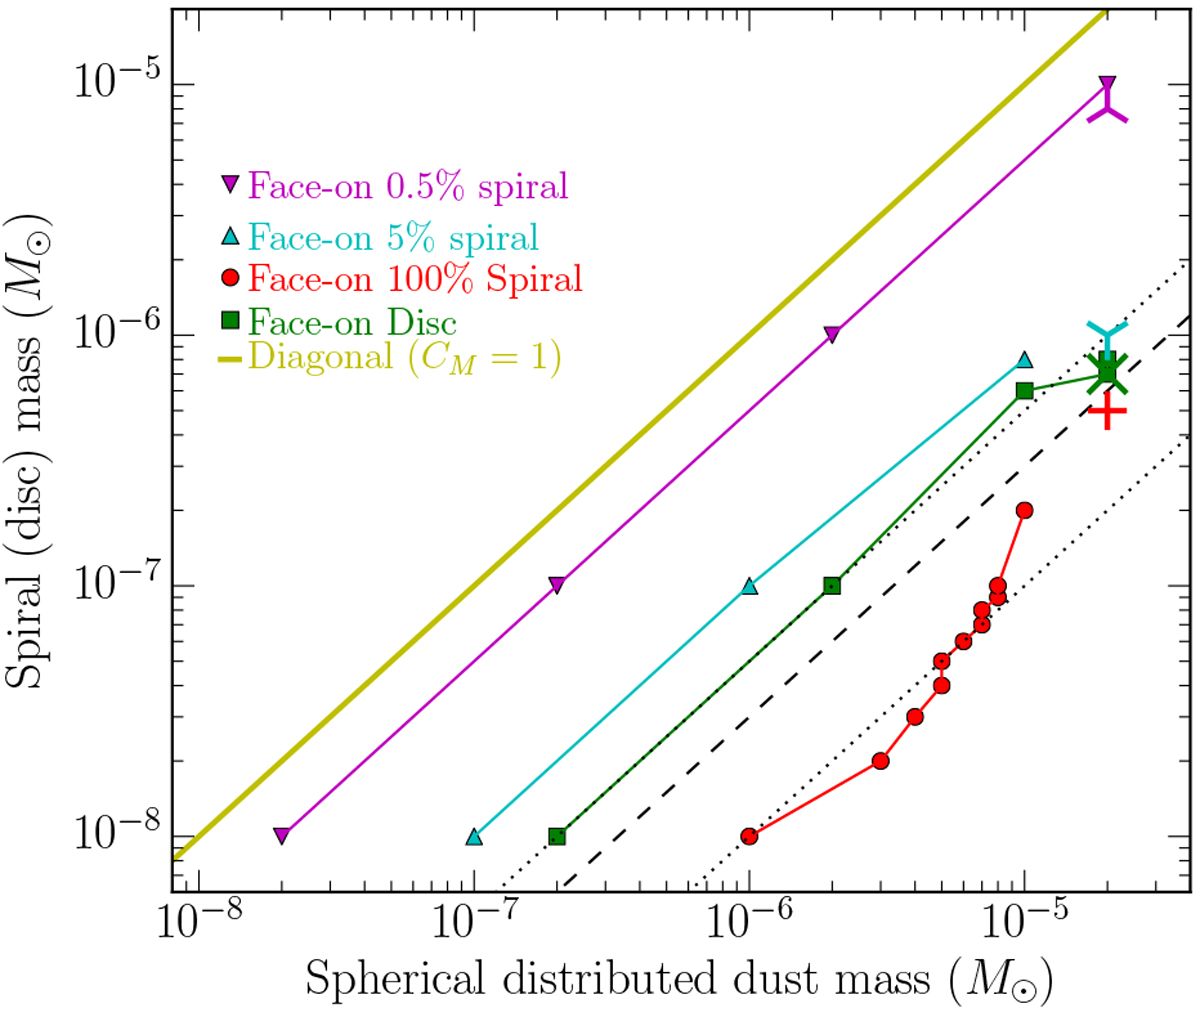
Masses of face-on distributions of spirals and discs on the y-axis, compared with corresponding spherical masses on the x-axis, from modelsTable 6, i.e. SEDs of spirals and discs that are similar to sphere-SEDs according to the limit
![]() , and their corresponding masses. The black dashed line is a common mass correction for the non-spherical geometries, CM (combined) ≈ 0.03 ± 0.02, with the black dotted lines being the uncertainties. Mass corrections found with best fits to the EP Aqr observed data (see Sect. 6.4 for details) are included as a green cross (disc), red plus (100% spiral), cyan Y (5% spiral), and magenta inverted Y (0.5% spiral). A diagonal yellow line is included to show where CM = 1.
, and their corresponding masses. The black dashed line is a common mass correction for the non-spherical geometries, CM (combined) ≈ 0.03 ± 0.02, with the black dotted lines being the uncertainties. Mass corrections found with best fits to the EP Aqr observed data (see Sect. 6.4 for details) are included as a green cross (disc), red plus (100% spiral), cyan Y (5% spiral), and magenta inverted Y (0.5% spiral). A diagonal yellow line is included to show where CM = 1.
Current usage metrics show cumulative count of Article Views (full-text article views including HTML views, PDF and ePub downloads, according to the available data) and Abstracts Views on Vision4Press platform.
Data correspond to usage on the plateform after 2015. The current usage metrics is available 48-96 hours after online publication and is updated daily on week days.
Initial download of the metrics may take a while.