Fig. 5
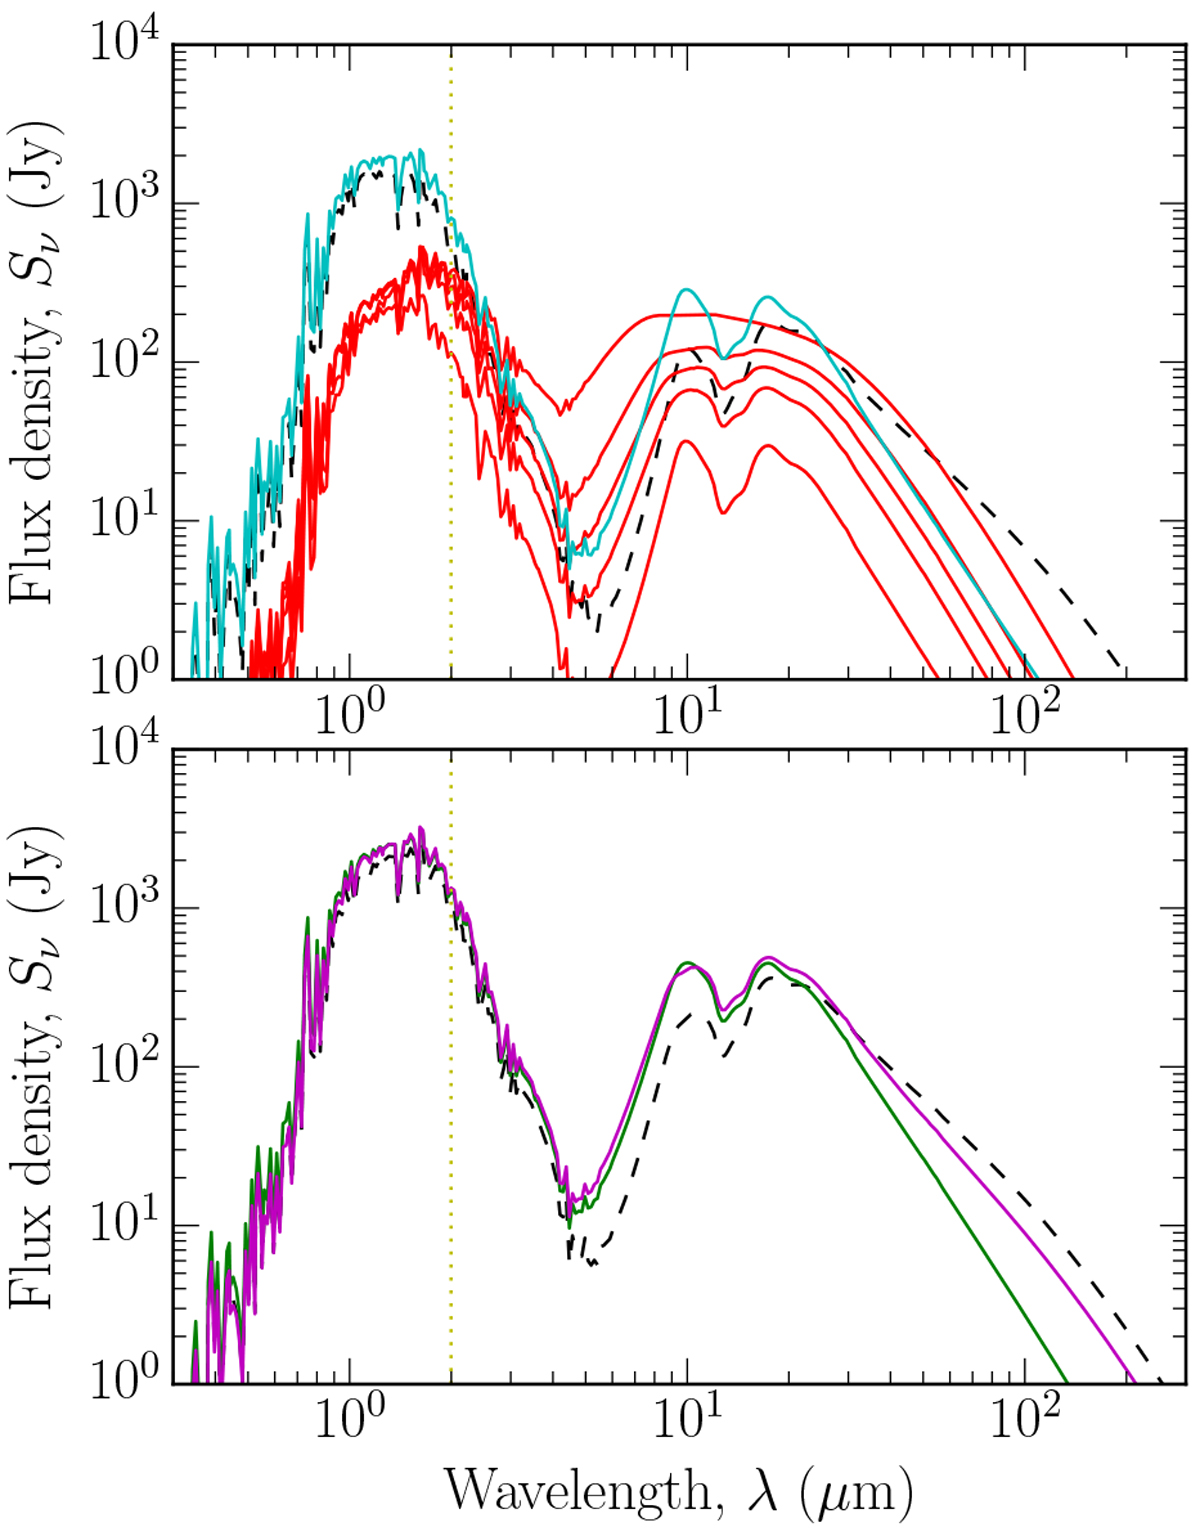
Comparisons of different “worst” cases of ![]() , for face-on spirals and discs, as listed in Table 6. Top panel: dust SEDs corresponding to the spherical dust mass of 1 × 10⁻⁵ M⊙ (black dashed line), i.e. face-on 100% spiral of mass 2 × 10⁻⁷ M⊙ and a few additional SEDs down to 1 × 10⁻⁸ M⊙ (red lines), and a face-on 5% spiral with the dust mass 8 × 10⁻⁷ M⊙ (cyan line). Bottom panel: dust SEDs corresponding to the spherical dust mass of 2 × 10⁻⁵ M⊙ (black dashed line), i.e. a face-on disc with the dust mass 8 × 10⁻⁷ M⊙ (green line), and a face-on 0.5% spiral with the dust mass 1 × 10⁻⁵ M⊙ (magenta line). The vertical yellow dotted line marks the wavelength limit of 2 μm.
, for face-on spirals and discs, as listed in Table 6. Top panel: dust SEDs corresponding to the spherical dust mass of 1 × 10⁻⁵ M⊙ (black dashed line), i.e. face-on 100% spiral of mass 2 × 10⁻⁷ M⊙ and a few additional SEDs down to 1 × 10⁻⁸ M⊙ (red lines), and a face-on 5% spiral with the dust mass 8 × 10⁻⁷ M⊙ (cyan line). Bottom panel: dust SEDs corresponding to the spherical dust mass of 2 × 10⁻⁵ M⊙ (black dashed line), i.e. a face-on disc with the dust mass 8 × 10⁻⁷ M⊙ (green line), and a face-on 0.5% spiral with the dust mass 1 × 10⁻⁵ M⊙ (magenta line). The vertical yellow dotted line marks the wavelength limit of 2 μm.
Current usage metrics show cumulative count of Article Views (full-text article views including HTML views, PDF and ePub downloads, according to the available data) and Abstracts Views on Vision4Press platform.
Data correspond to usage on the plateform after 2015. The current usage metrics is available 48-96 hours after online publication and is updated daily on week days.
Initial download of the metrics may take a while.