Fig. 4
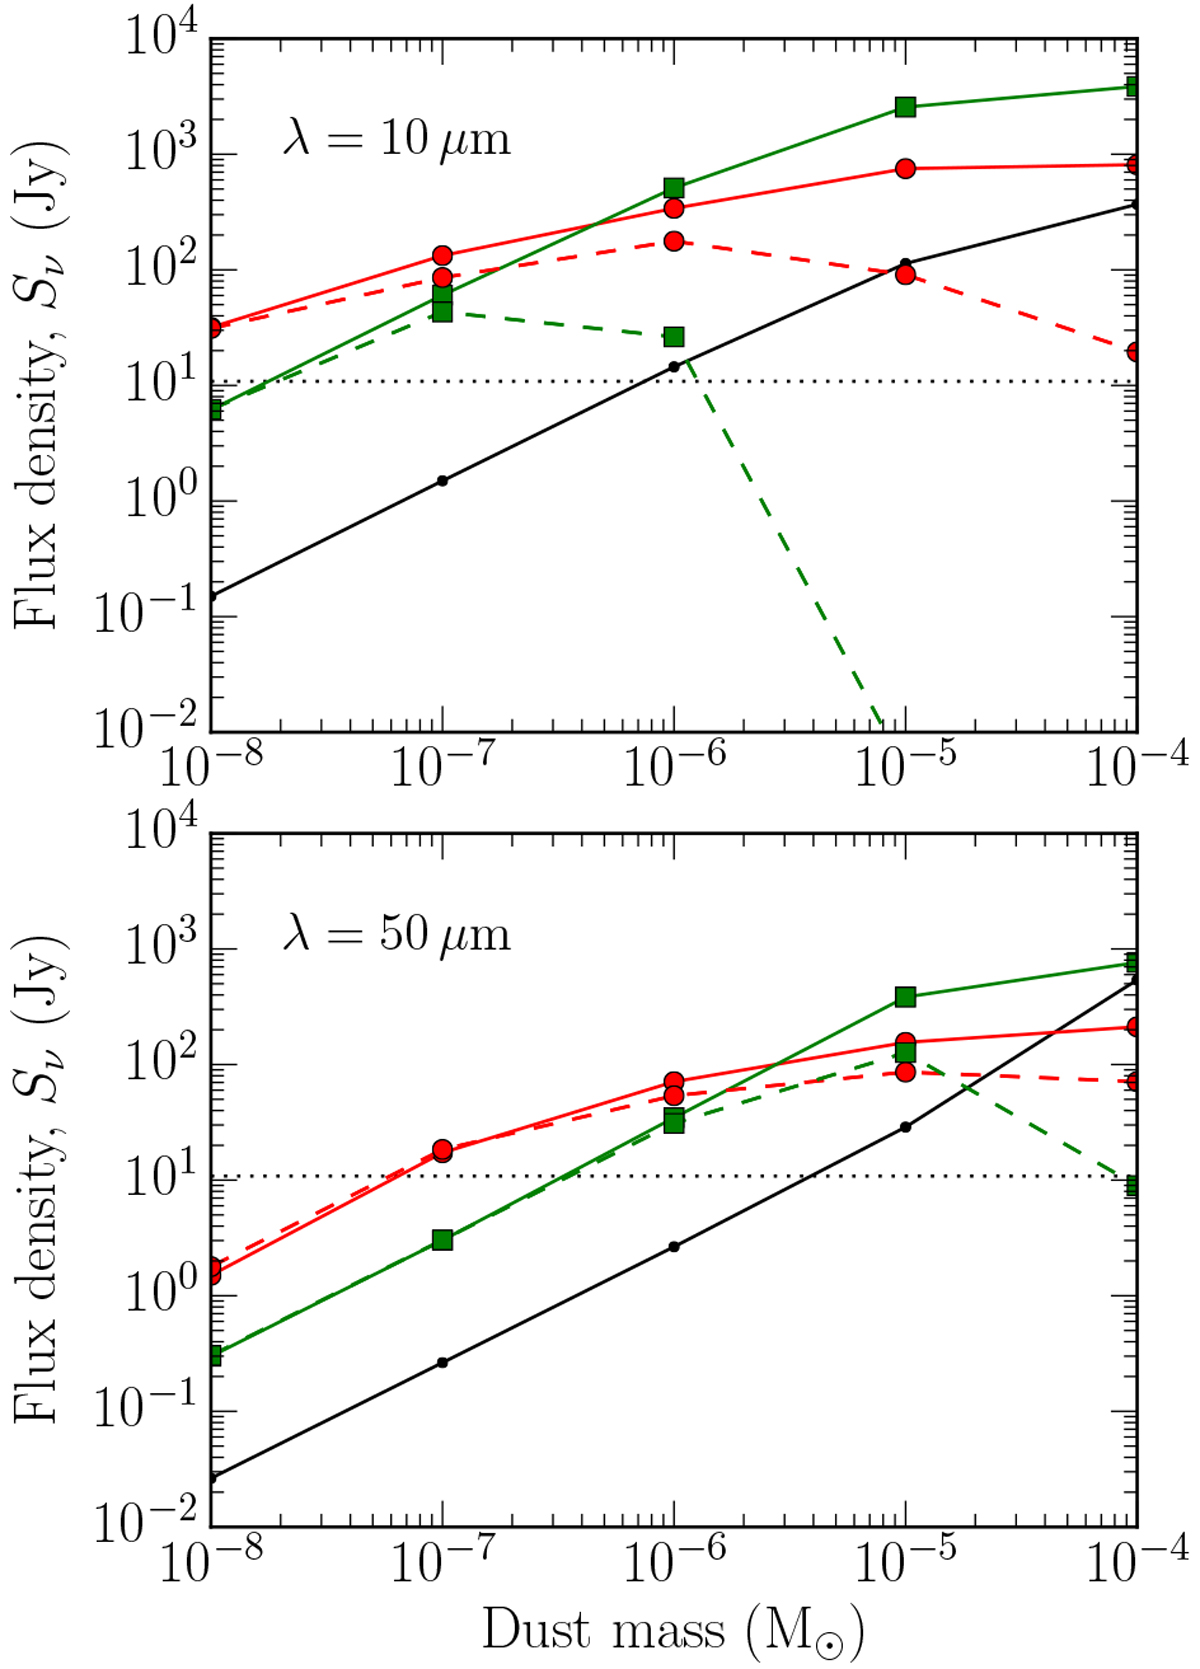
Comparisons of dust flux densities from Fig. 3 at 10 μm (top panel) and 50 μm (bottom panel) for spheres (black with dots), spirals (red with circles) and discs (green with squares) without a spherical component, and as seen face-on (solid lines) or edge-on (dashed lines). The horizontal black dotted line shows the flux density threshold of 3 σISO ≈ 10.8 Jy.
Current usage metrics show cumulative count of Article Views (full-text article views including HTML views, PDF and ePub downloads, according to the available data) and Abstracts Views on Vision4Press platform.
Data correspond to usage on the plateform after 2015. The current usage metrics is available 48-96 hours after online publication and is updated daily on week days.
Initial download of the metrics may take a while.