Fig. 8.
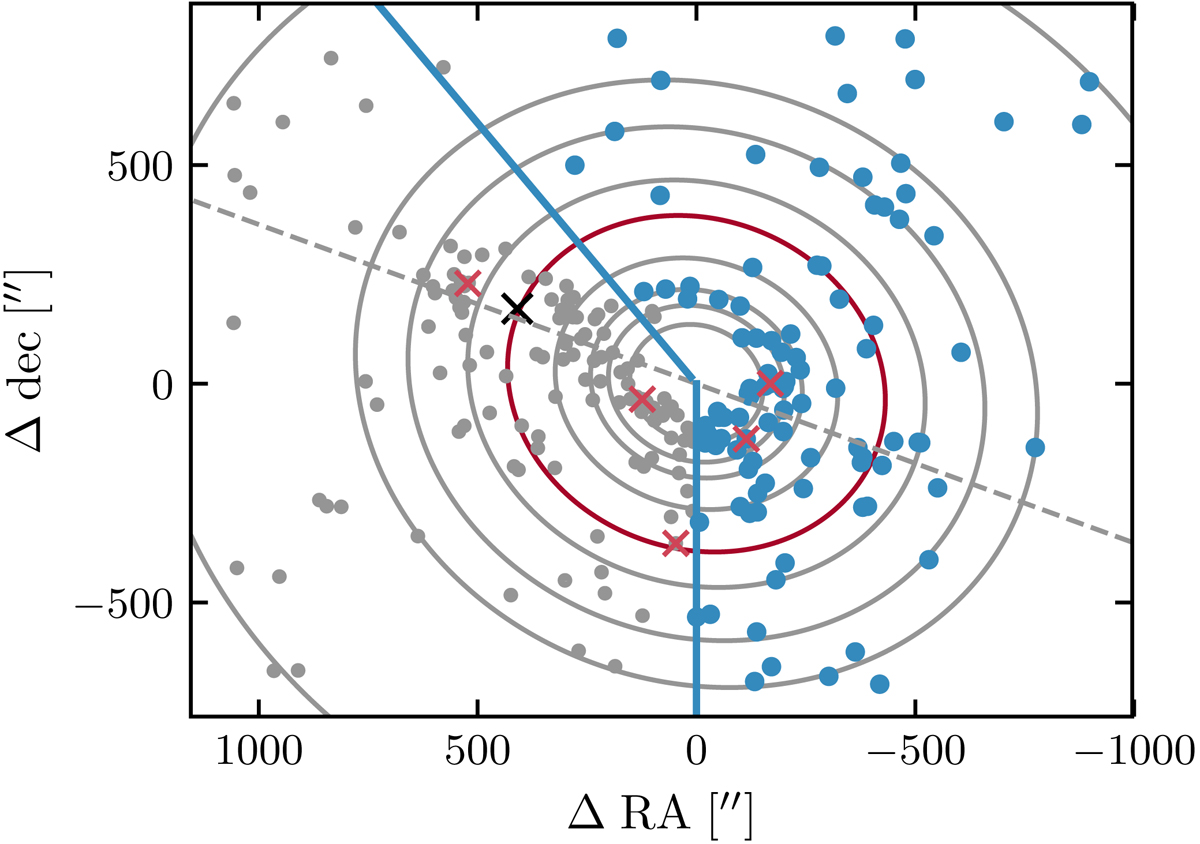
On-sky PN distribution for the PN density and PNLF calculation in M 105. Only PNe from the imaging survey and to the right of the blue lines are considered (see text) to limit the contamination from NGC 3384 PNe. The PN density of M 105 is calculated in nine elliptical bins denoted in grey. The dashed line indicates the photometric major axis of M 105. The red contour corresponds to the vertical dashed line in Fig. 9. The black cross denotes the centre of NGC 3384. PNe within 0.5 mag from the PNLF bright cut-off at the distance of M 105 are marked with red crosses. North is up, and east is to the left.
Current usage metrics show cumulative count of Article Views (full-text article views including HTML views, PDF and ePub downloads, according to the available data) and Abstracts Views on Vision4Press platform.
Data correspond to usage on the plateform after 2015. The current usage metrics is available 48-96 hours after online publication and is updated daily on week days.
Initial download of the metrics may take a while.