Fig. 6.
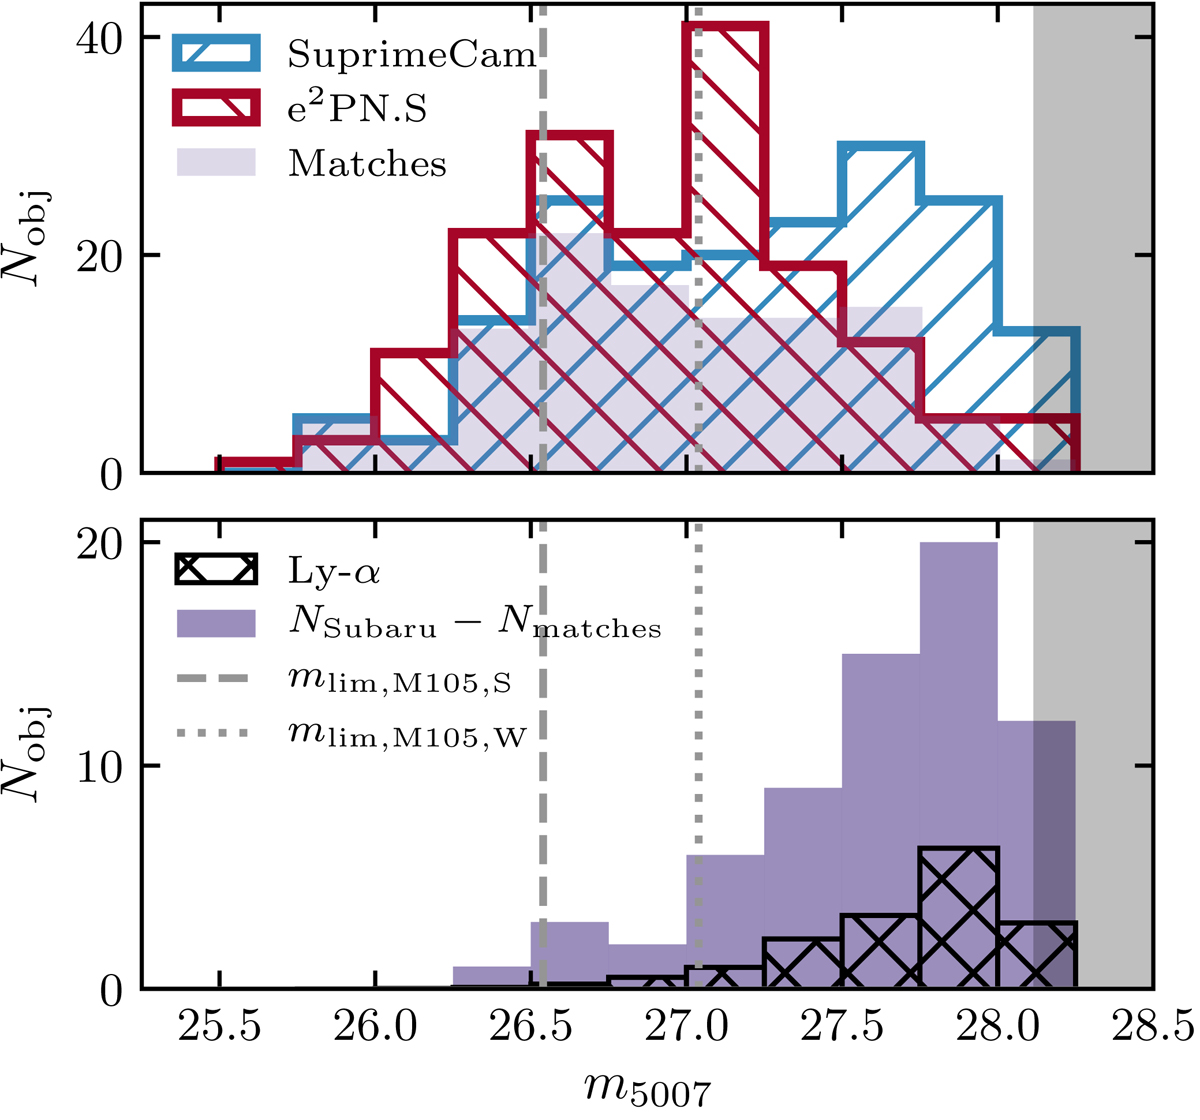
Top: magnitude distribution of PN candidates from the SuprimeCam survey (hatched blue histogram) and PNe from the e2PN.S survey (hatched red histogram) in the region of overlap highlighted in Fig. 5. The magnitude distribution of objects identified in both surveys is shown in purple. The vertical lines denote the limiting magnitudes of the two shallowest e2PN.S fields, and the shaded grey region denotes magnitudes fainter than the limiting magnitude of the SuprimeCam survey. Bottom: magnitude distribution of PN candidates from the SuprimeCam survey with no counterpart in the e2PN.S (purple). The hatched histogram shows the expected distribution of background Ly-α galaxies at redshift z = 3.1 in the region of overlap scaled by the photometric completeness of the SuprimeCam survey.
Current usage metrics show cumulative count of Article Views (full-text article views including HTML views, PDF and ePub downloads, according to the available data) and Abstracts Views on Vision4Press platform.
Data correspond to usage on the plateform after 2015. The current usage metrics is available 48-96 hours after online publication and is updated daily on week days.
Initial download of the metrics may take a while.