Free Access
Fig. 4.
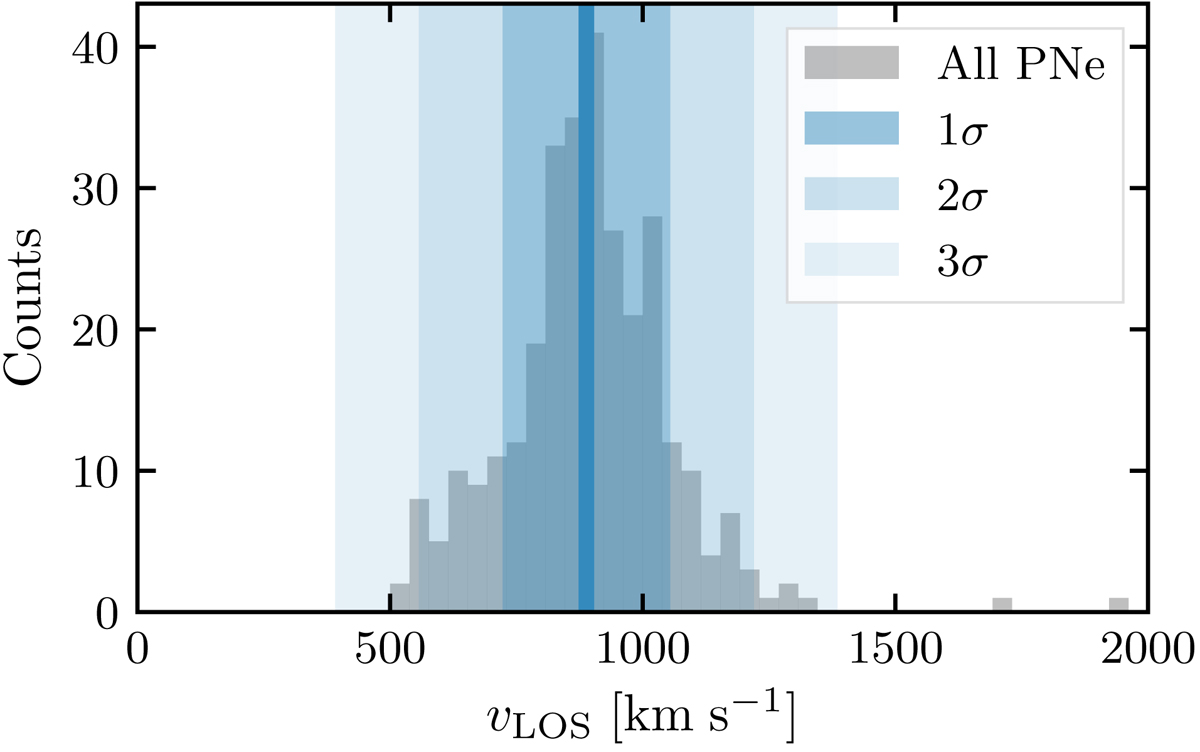
Line-of-sight velocity distribution of PNe from the e2PN.S survey. The blue shaded regions denote the 1, 2, and 3σ intervals from the mean velocity (blue vertical line) of the sample. The double-peaked and asymmetric nature of the histogram is due to the fact that the survey covers NGC 3384 as well as M 105.
Current usage metrics show cumulative count of Article Views (full-text article views including HTML views, PDF and ePub downloads, according to the available data) and Abstracts Views on Vision4Press platform.
Data correspond to usage on the plateform after 2015. The current usage metrics is available 48-96 hours after online publication and is updated daily on week days.
Initial download of the metrics may take a while.