Fig. A.2.
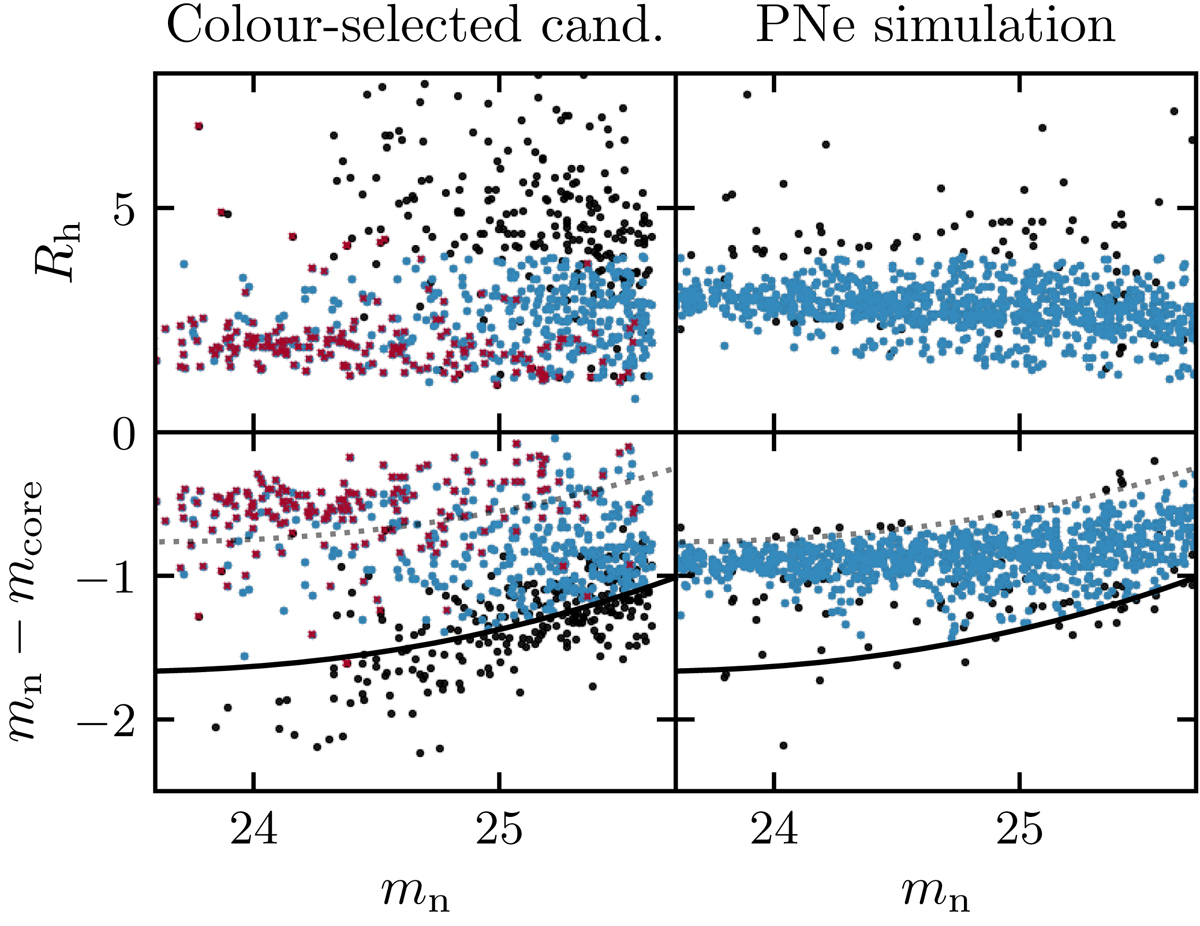
Point-source test for PN candidates in M 105. Left column: colour-selected PNe candidates. Right column: simulated PNe. Top row: half-light radius Rh as function of magnitude mn. Bottom row: mn − mcore as function of magnitude mn. In each panel, blue dots denote the PNe candidates selected based on their point-like appearance. Left column: red crosses denote cross-matches with the PN.S catalogue, which place additional constraints on the morphology of the selected PNe candidates from Subaru photometry.
Current usage metrics show cumulative count of Article Views (full-text article views including HTML views, PDF and ePub downloads, according to the available data) and Abstracts Views on Vision4Press platform.
Data correspond to usage on the plateform after 2015. The current usage metrics is available 48-96 hours after online publication and is updated daily on week days.
Initial download of the metrics may take a while.