Fig. A.1.
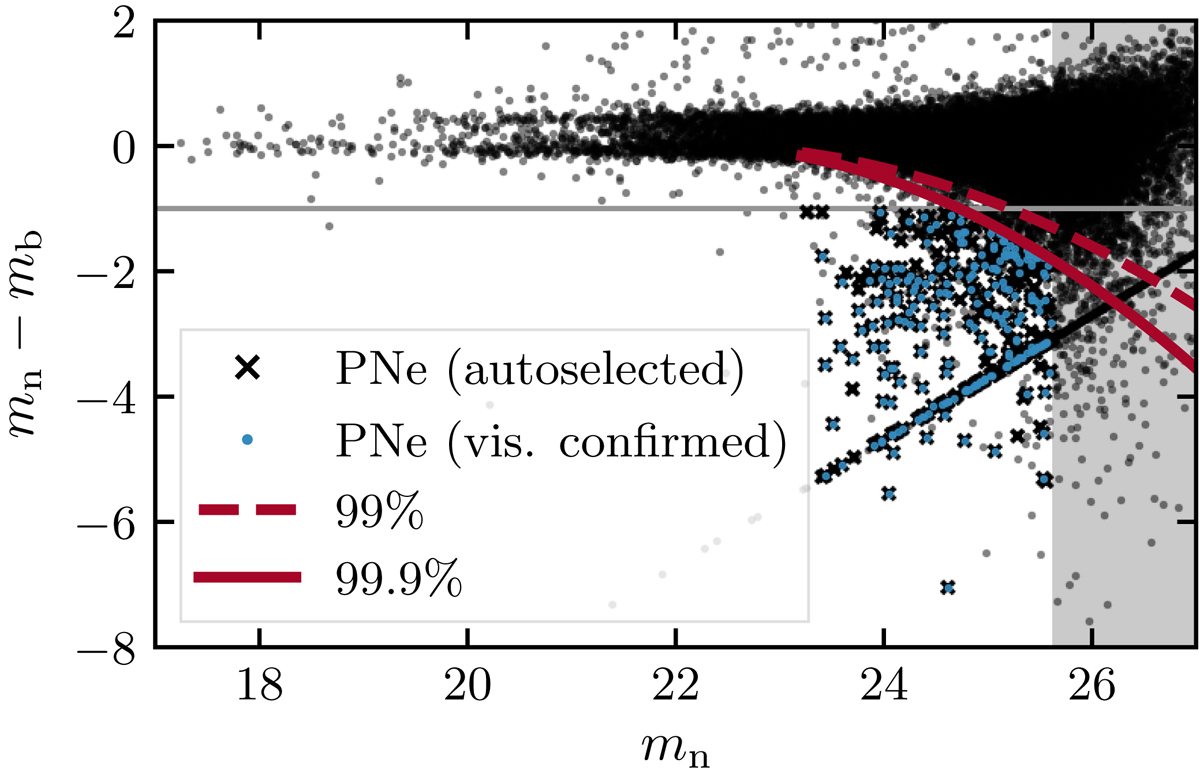
CMD for all sources (black dots) in the M 105 Suprime Cam field. Obects that lay below the grey horizontal line at mn − mb = −1 are emission-line objects with an equivalent width EWobs ≥ 110 Å. The magnitude range that is fainter than the limiting magnitude is denoted by the shaded grey region. The dashed (solid) red lines denote the 99.9% (99.9%) limits of the simulated foreground population. Black crosses denote the PNe candidates that were automatically selected, and blue dots denote those that were confirmed by visual inspection.
Current usage metrics show cumulative count of Article Views (full-text article views including HTML views, PDF and ePub downloads, according to the available data) and Abstracts Views on Vision4Press platform.
Data correspond to usage on the plateform after 2015. The current usage metrics is available 48-96 hours after online publication and is updated daily on week days.
Initial download of the metrics may take a while.