Fig. 12.
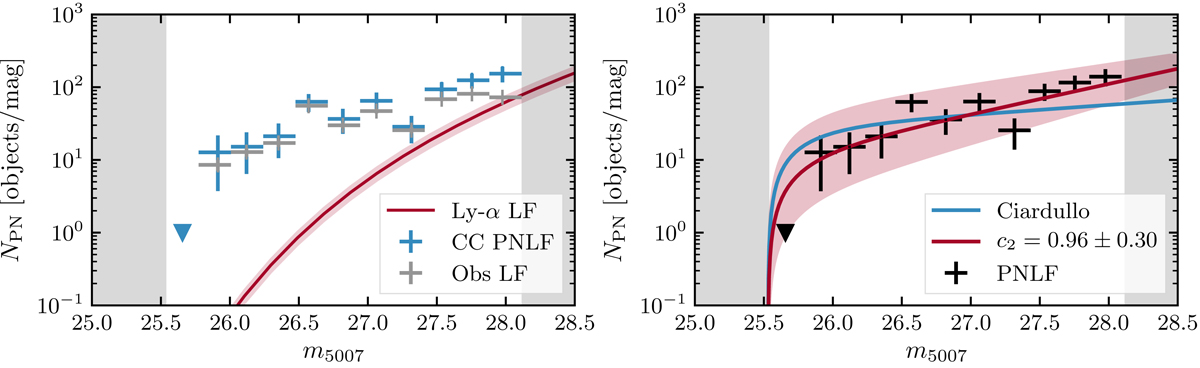
PNLF in M 105. Left: observed LF of PN candidates (grey crosses) and PNLF of the completeness-corrected (CC) sample as defined in Fig. 8 (101 PNe) without accounting for contamination by Ly-α emitting background galaxies (blue crosses). Triangles denote upper limits. The solid red line shows the Ly-α LF and its variance due to density fluctuations indicated by the shaded regions (Gronwall et al. 2007). Right: PNLF of the completeness-corrected PN sample after statistical subtraction of the Ly-α LF (black crosses). Triangles denote upper limits. The solid blue curve denotes the standard Ciardullo PNLF with c2 = 0.307. The red line and shaded region denote our best-fit PNLF with c2 = 0.96 ± 0.30 In both panels, magnitudes fainter than the limiting magnitude and brighter than the bright cut-off are shaded in grey.
Current usage metrics show cumulative count of Article Views (full-text article views including HTML views, PDF and ePub downloads, according to the available data) and Abstracts Views on Vision4Press platform.
Data correspond to usage on the plateform after 2015. The current usage metrics is available 48-96 hours after online publication and is updated daily on week days.
Initial download of the metrics may take a while.